
CASE STUDY
Building a fleet system designed for visibility and control
A 6-month platform build that unified booking, fleet, drivers, and finance.
Then a post-delivery discovery that led to a deeper operational problem and a purpose-built predictive system to solve it.
SCOPE
0 -> 1
TEAM
2 Designers
Platform
Web and Mobile WPA
TIMELINE
8 Weeks
00
Executive
summary
The brief
Bluestar's fleet operations ran across five separate tools: one for bookings, one for driver records, spreadsheets for finance, a separate system for vehicle tracking, and WhatsApp for coordination. Nothing talked to anything else. Every task required manual reconciliation across platforms.
WHAT WE DID
We designed and built a unified platform: five modules connected to a single database. Post-launch, we ran structured feedback sessions with operators and uncovered a problem the new platform had not solved: cascading trip delays. We designed a predictive intervention system on top of the platform to address it.
IMPACT
Eliminated manual coordination, reducing month-end reconciliation from days to hours. By tackling cascading delays, improvement in operational visibility shifted operators from reactive firefighting to proactive intervention. The broader business metric story is detailed in the Impact section.
BEFORE WE BEGIN
Supabase
BACKEND
Figma MCP
DESIGN
Claude Code
AGENTIC AI
Cursor
IDE
Vercel
SERVER

My favorite part of this process was stepping into technical territories I hadn’t explored before. Using AI as a collaborator, I built segments of this system end-to-end, which fundamentally changed my design philosophy.
It’s an exciting time to be a designer.
We are no longer limited to shaping interfaces and experiences; we are now actively shaping systems, logic, and ultimate outcomes.
01
Introduction
Bluestar is a B2B fleet management company operating across multiple Indian cities. They provide contracted vehicle and driver services to corporate clients: employee transportation, logistics runs, and executive travel. Clients pay per trip; Bluestar manages the fleet, the drivers, the scheduling, and the billing on their behalf.
SCALE
1800+
Active vehicles
Across sedan, SUV, and luxury categories
4
CITIES
Operations running in 4 cities at project start
B2B
Revenue model
Per-trip billing to corporate accounts
02
Users and business
Three users interact with the system. Our focus was the operator: the person whose efficiency the platform was built to improve.
PRIMARY PERSONA
Operators (Admins)
Responsible for creating booking, assigning and dispatching vehicle and generating duty invoice
~200
Vehicles per operator
~80%
Operations were manual
~35%
Effort on reconciliation
PAIN POINTS IN CURRENT WORKFLOW
Booking confirmations spread across 5 separate tools with no single view.
Vehicle availability checked by phone call, not live data.
Driver assignment sent over WhatsApp with no audit trail or confirmation loop.
No visibility into a duty once it was in progress until the driver manually informed completion.
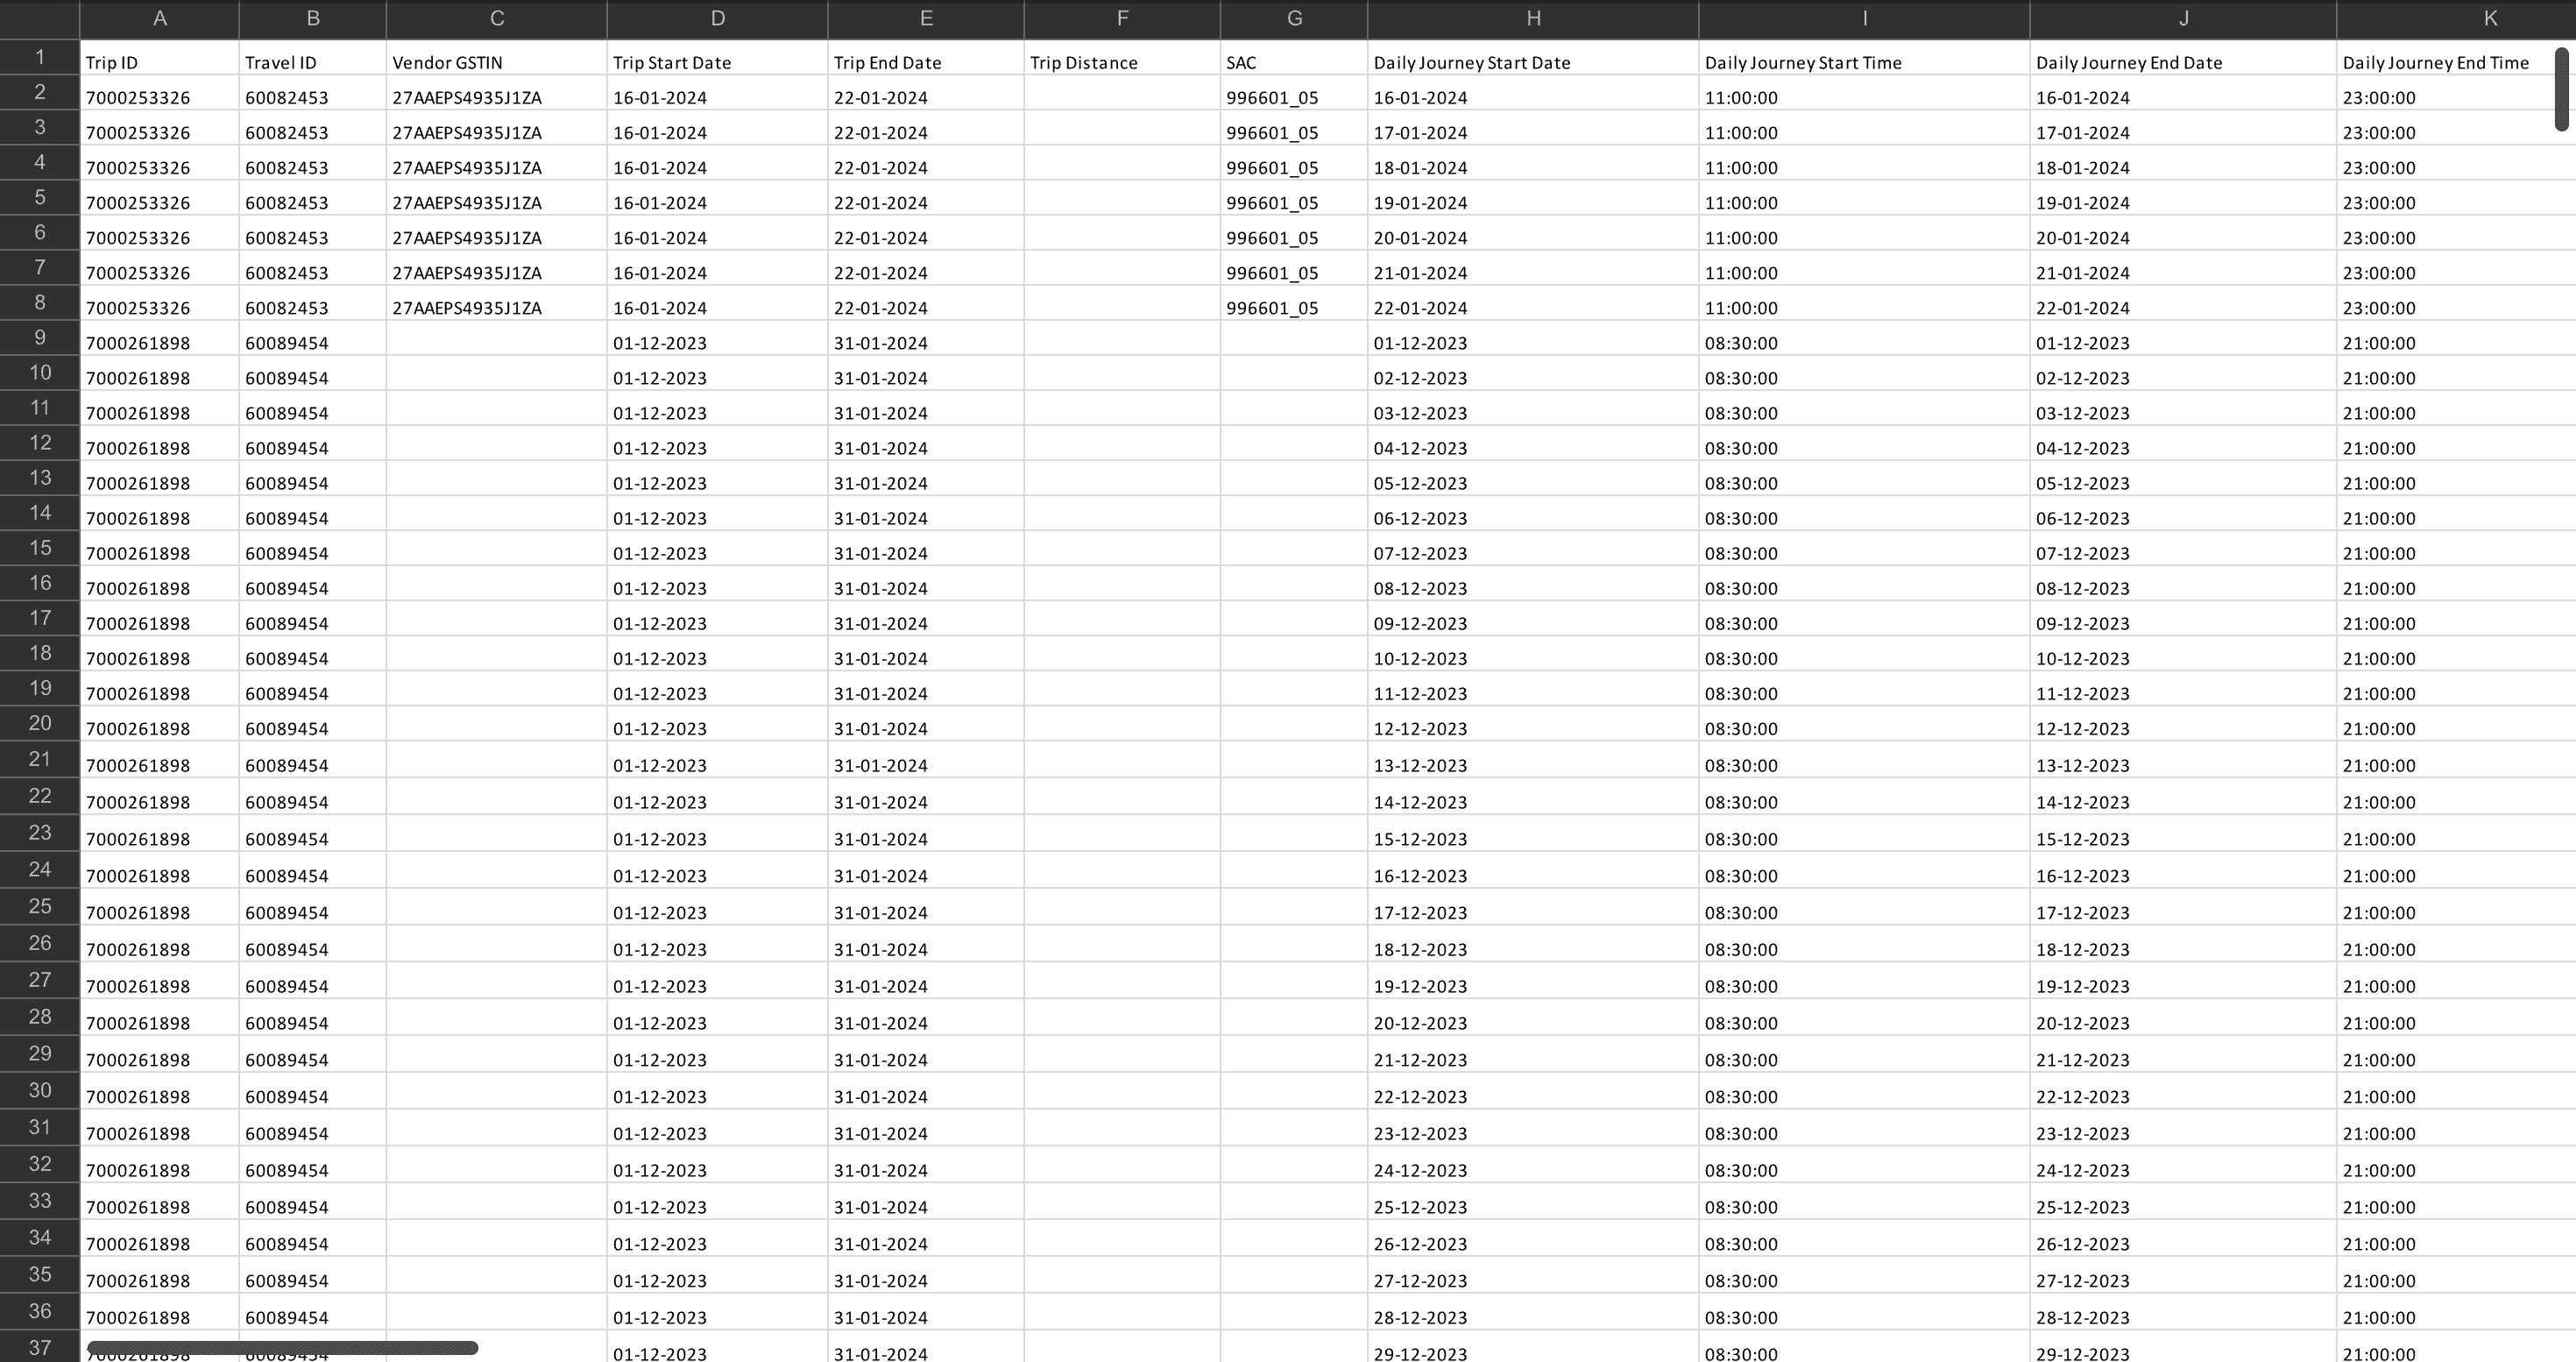
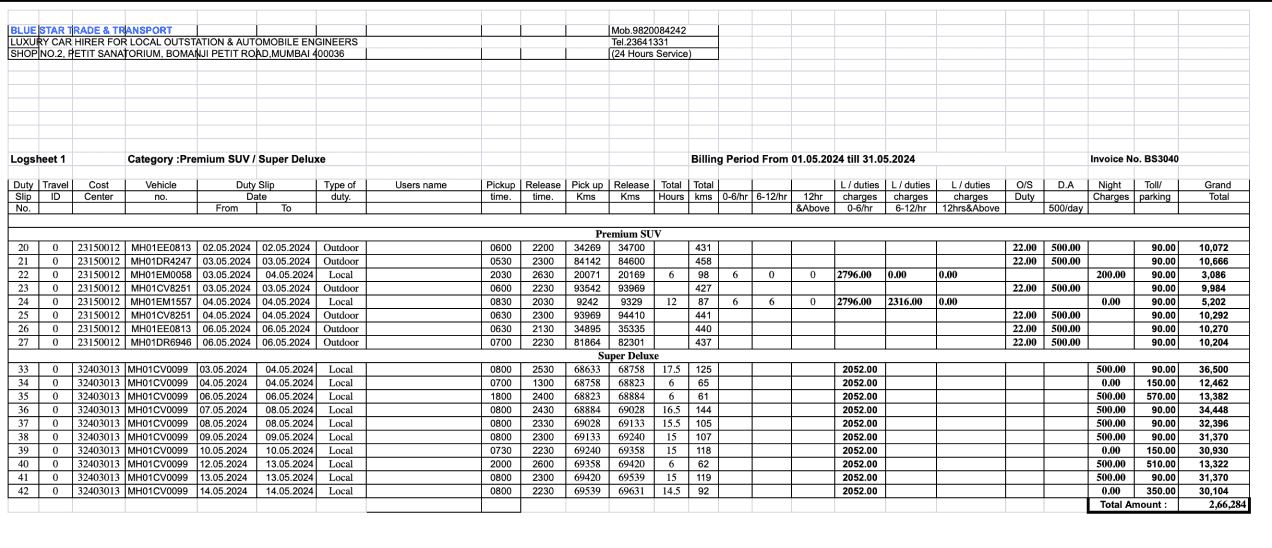
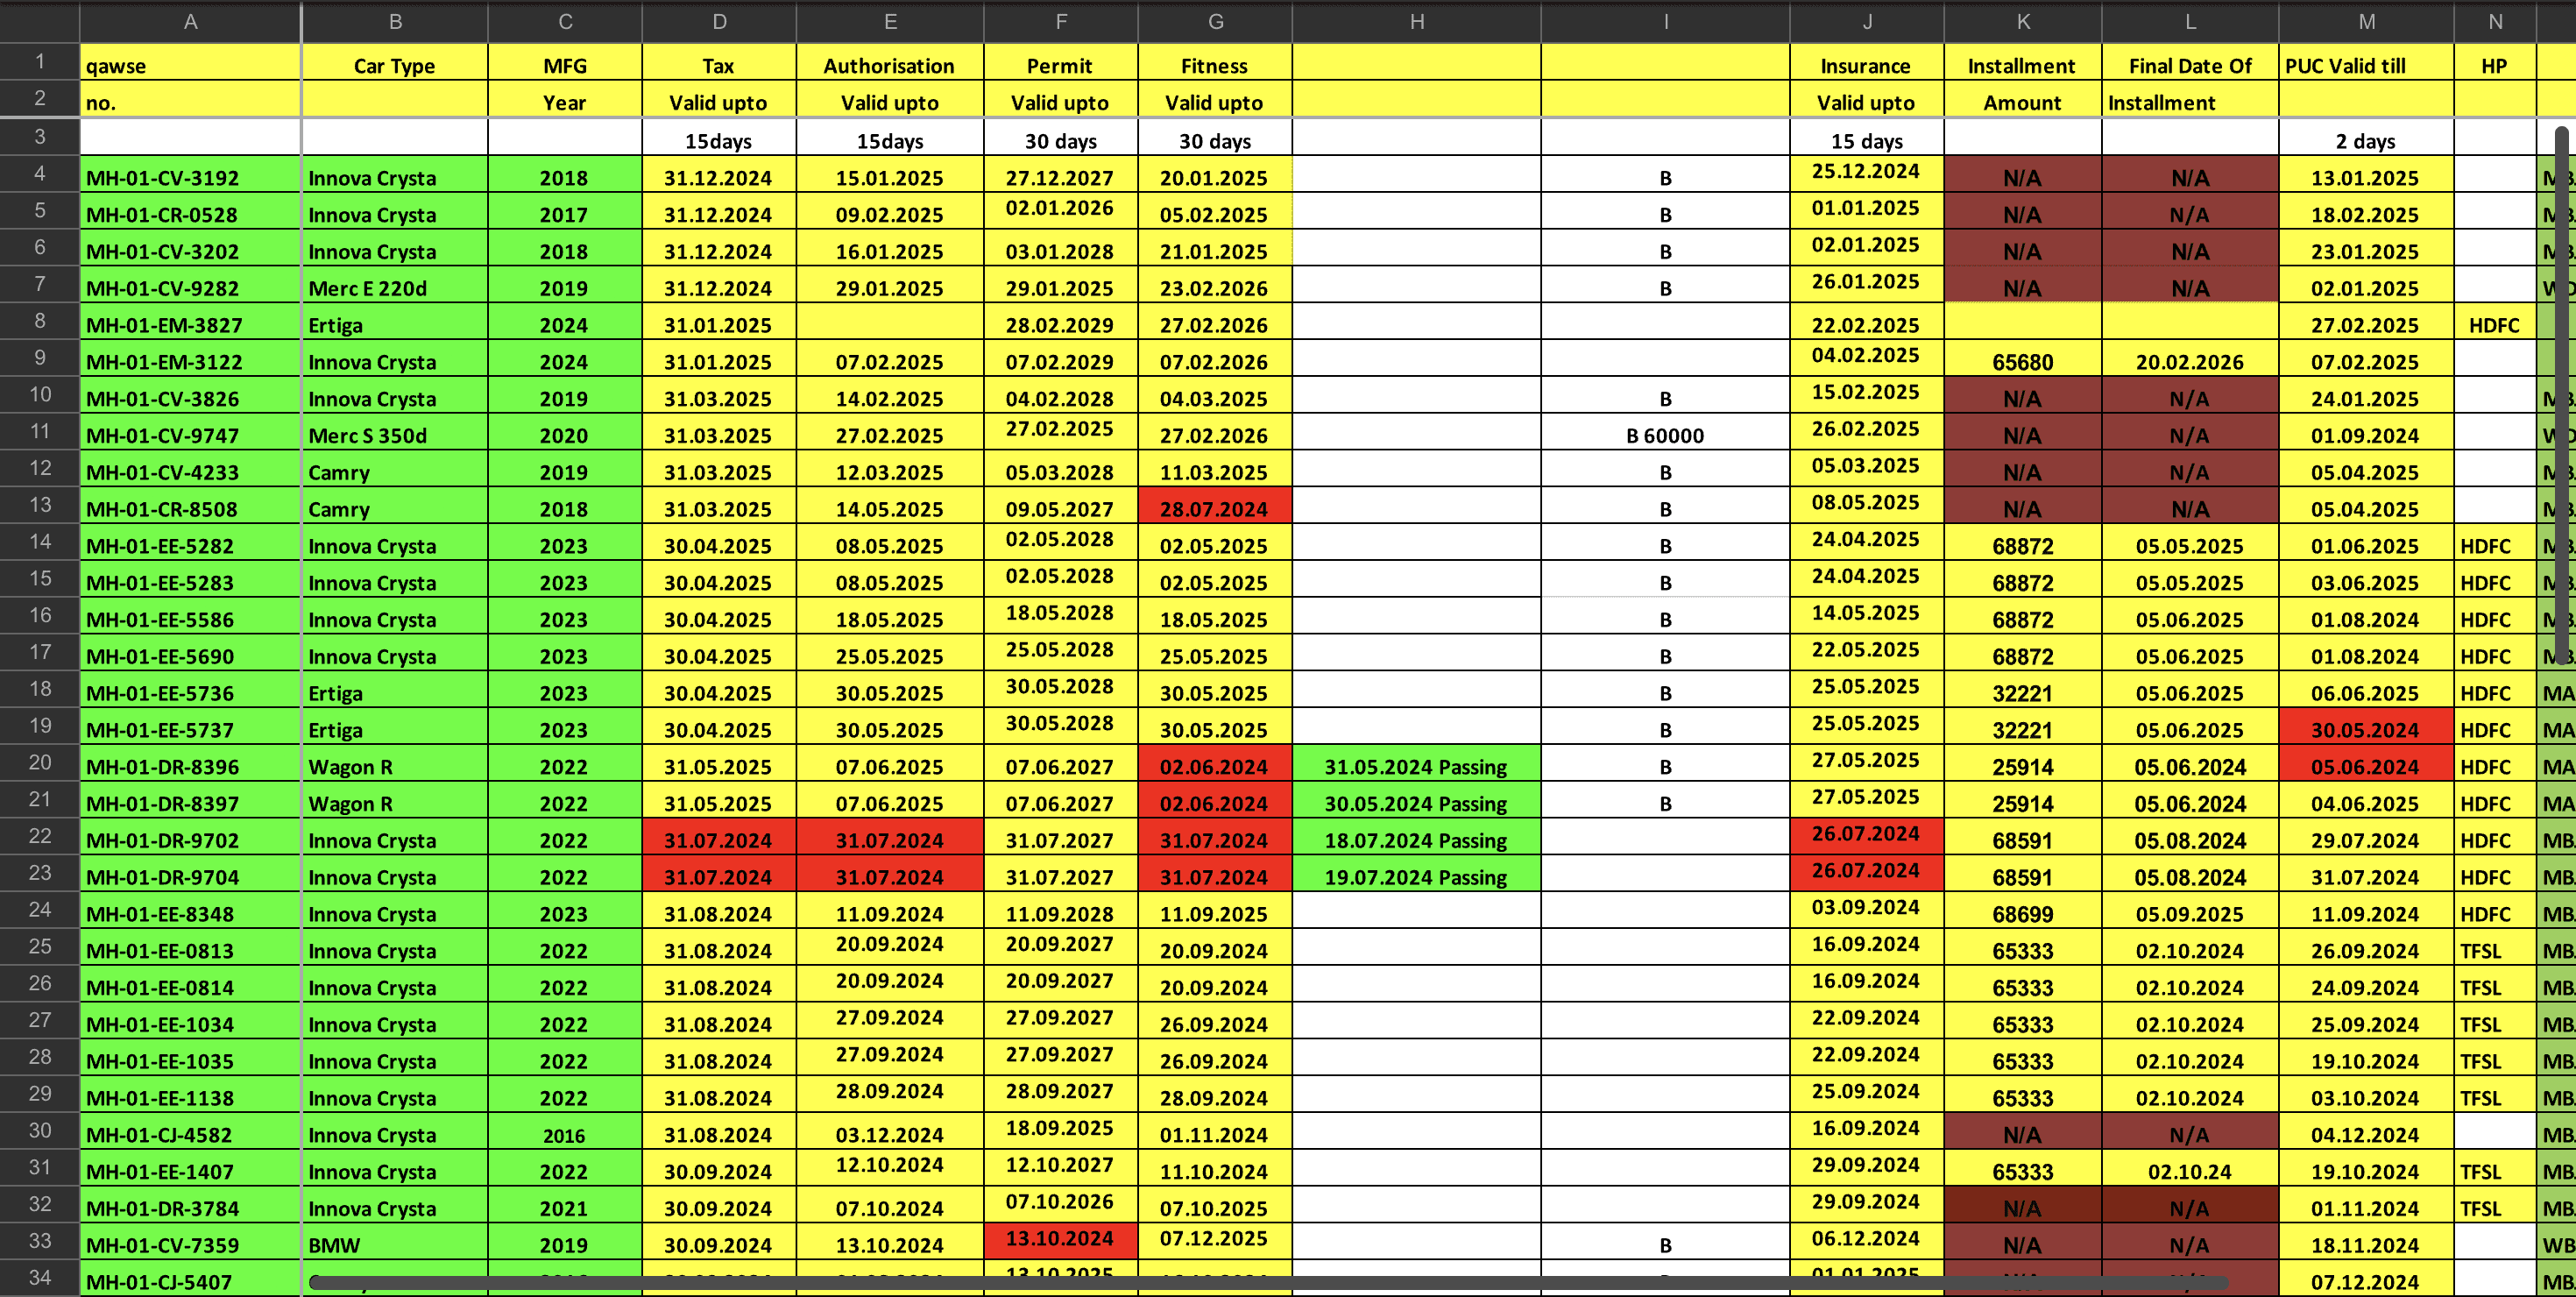
MULTIPLE
SPREADSHEET
SECONDARY PERSONA
Drivers
Assigned to duties by operators. Receive trip details and completes the duty.
Passengers
They book Bluestar's transport services via their company and have no direct access to the platform.
BUSINESS IMPACT
Revenue leakage
Billing errors and missed invoice generation meant trips occasionally went unbilled or were invoiced late, delaying cash flow.
Asset underutilisation
Double-booking led to last-minute cancellations and idle vehicles. No live availability meant planners couldn't optimise allocation.
Staff overhead
Fleet managers and finance staff spent significant time on coordination and reconciliation that produced no new value.
03
Unifying the workflow
Both designers wrote production code. The design was not handed off. It was shipped.
LAYING THE Platform architecture
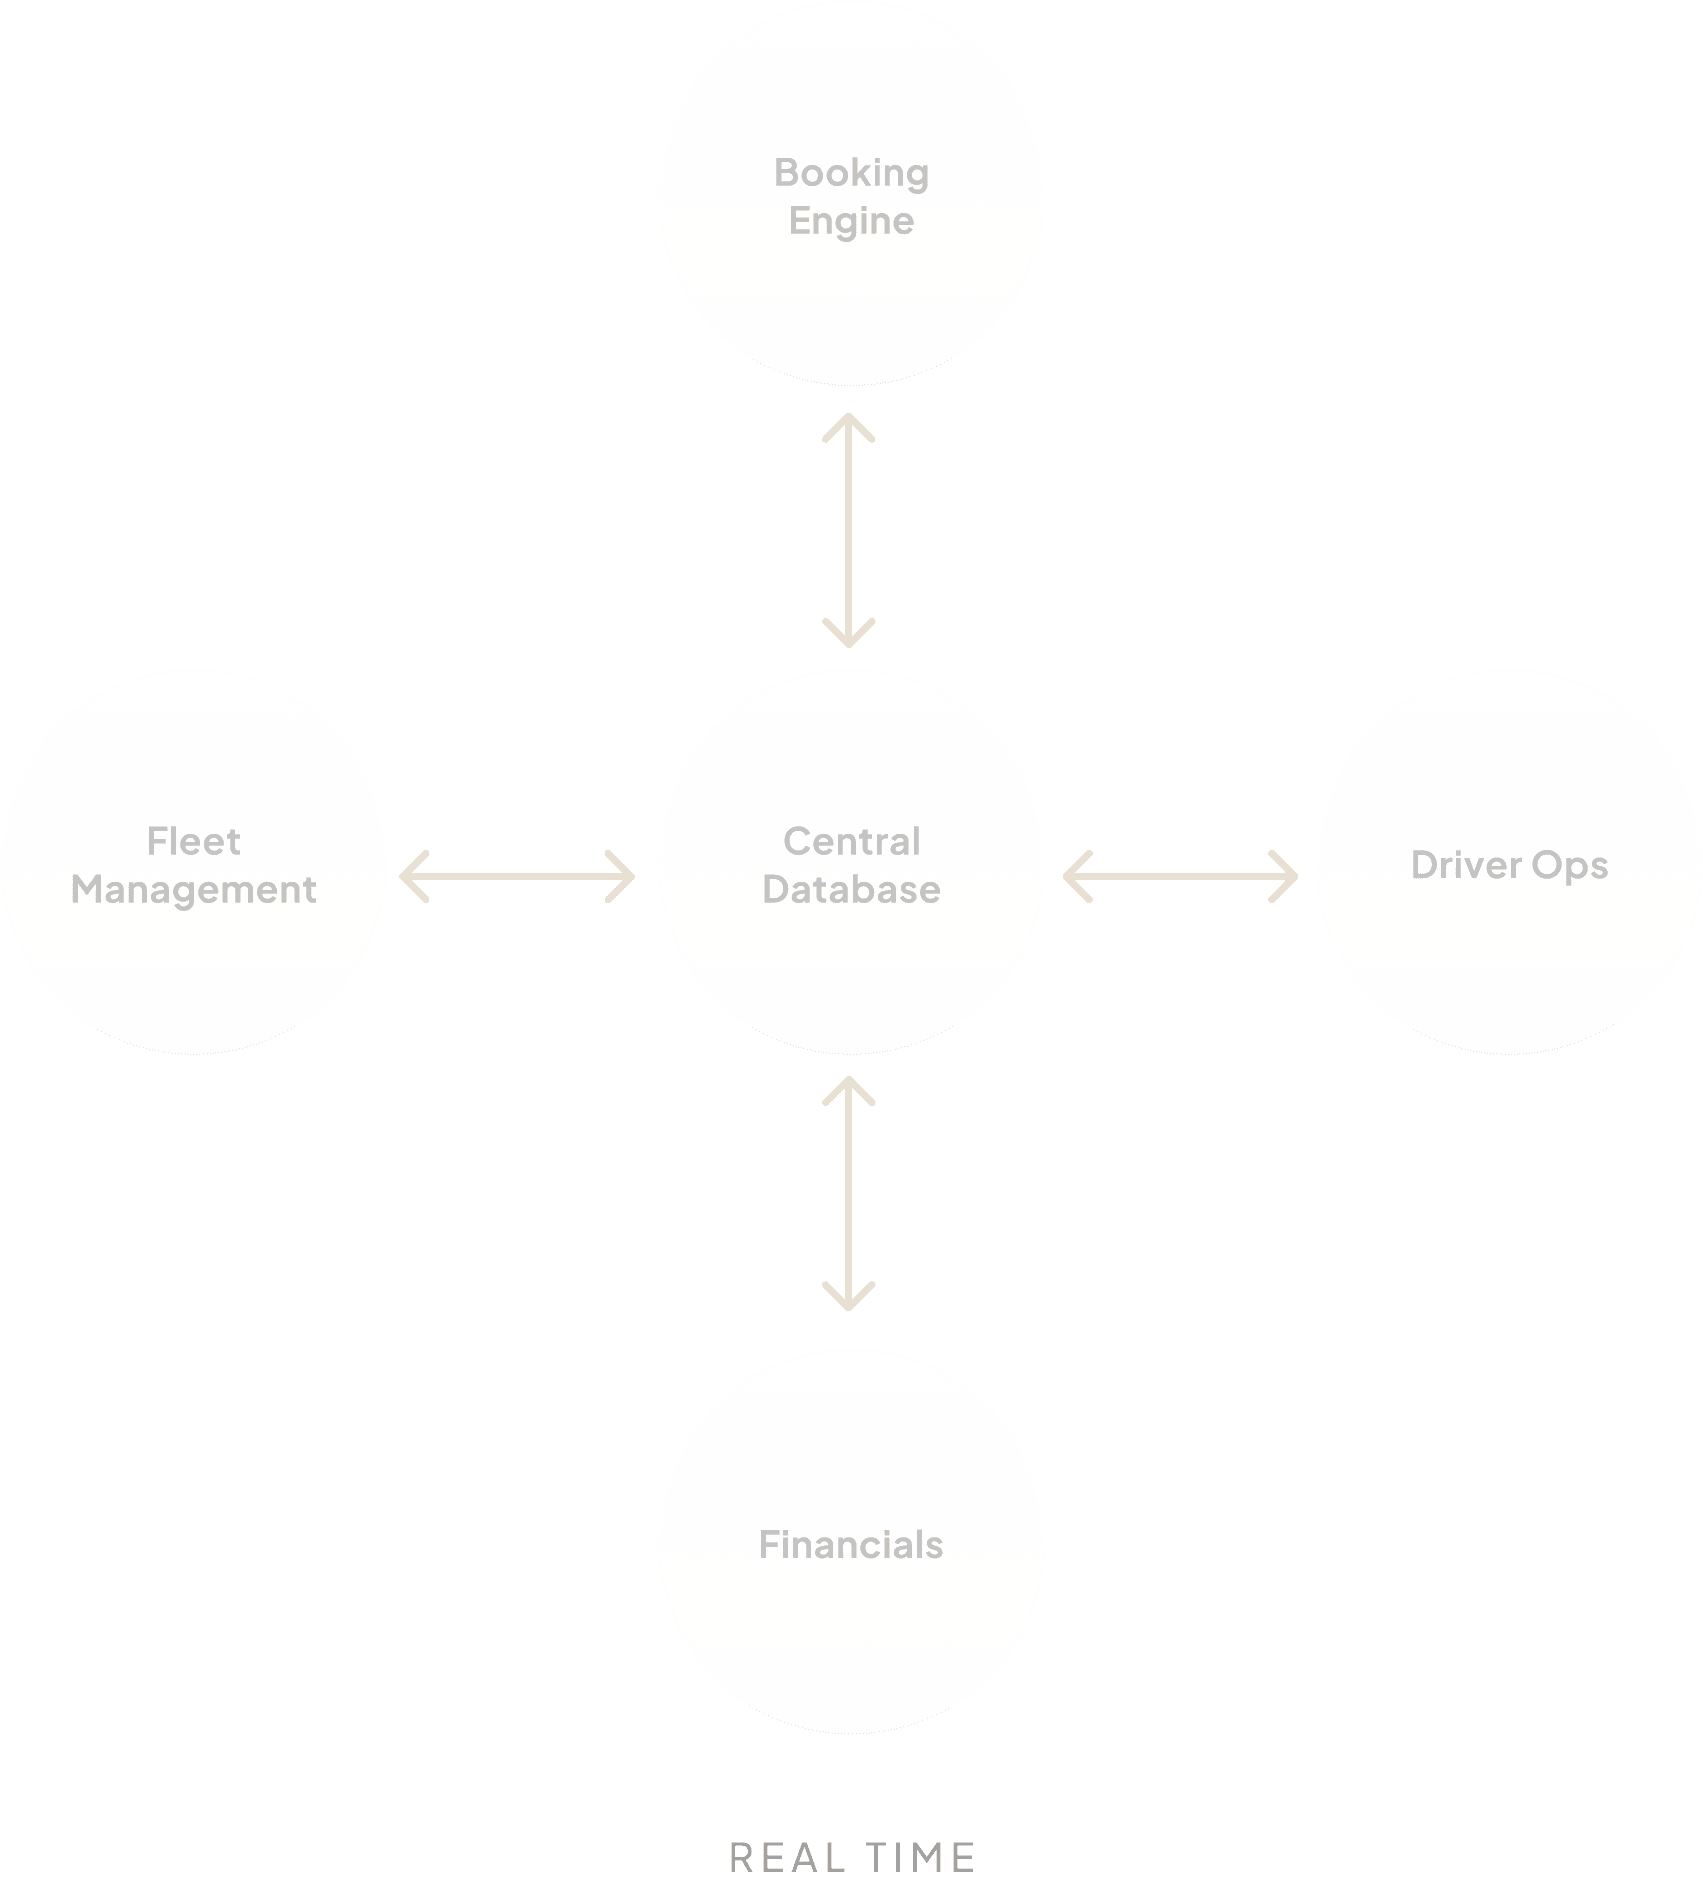
SINGLE SOURCE OF TRUTH
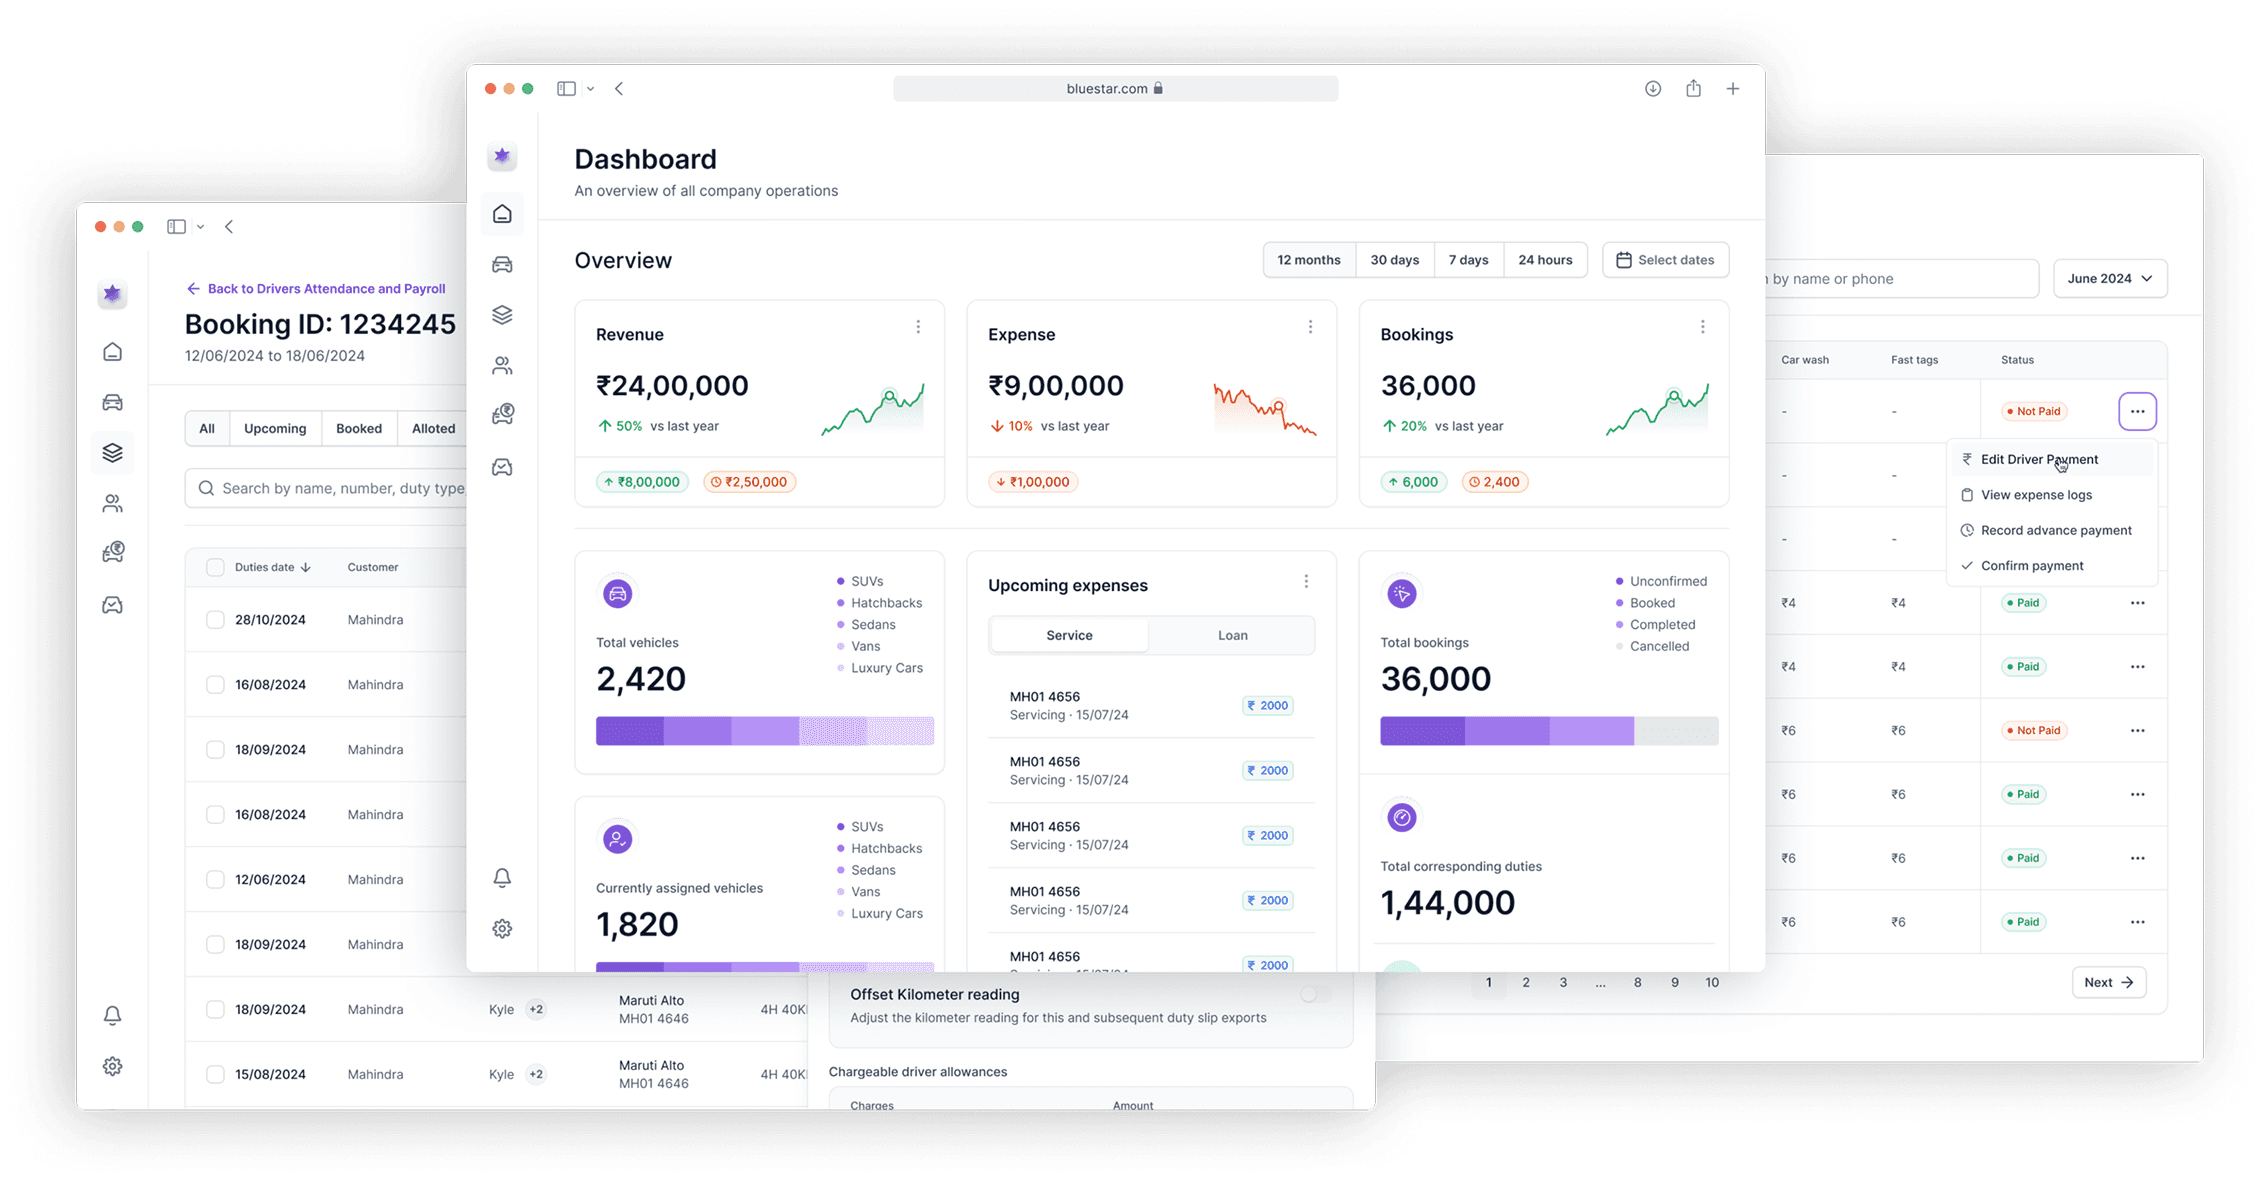
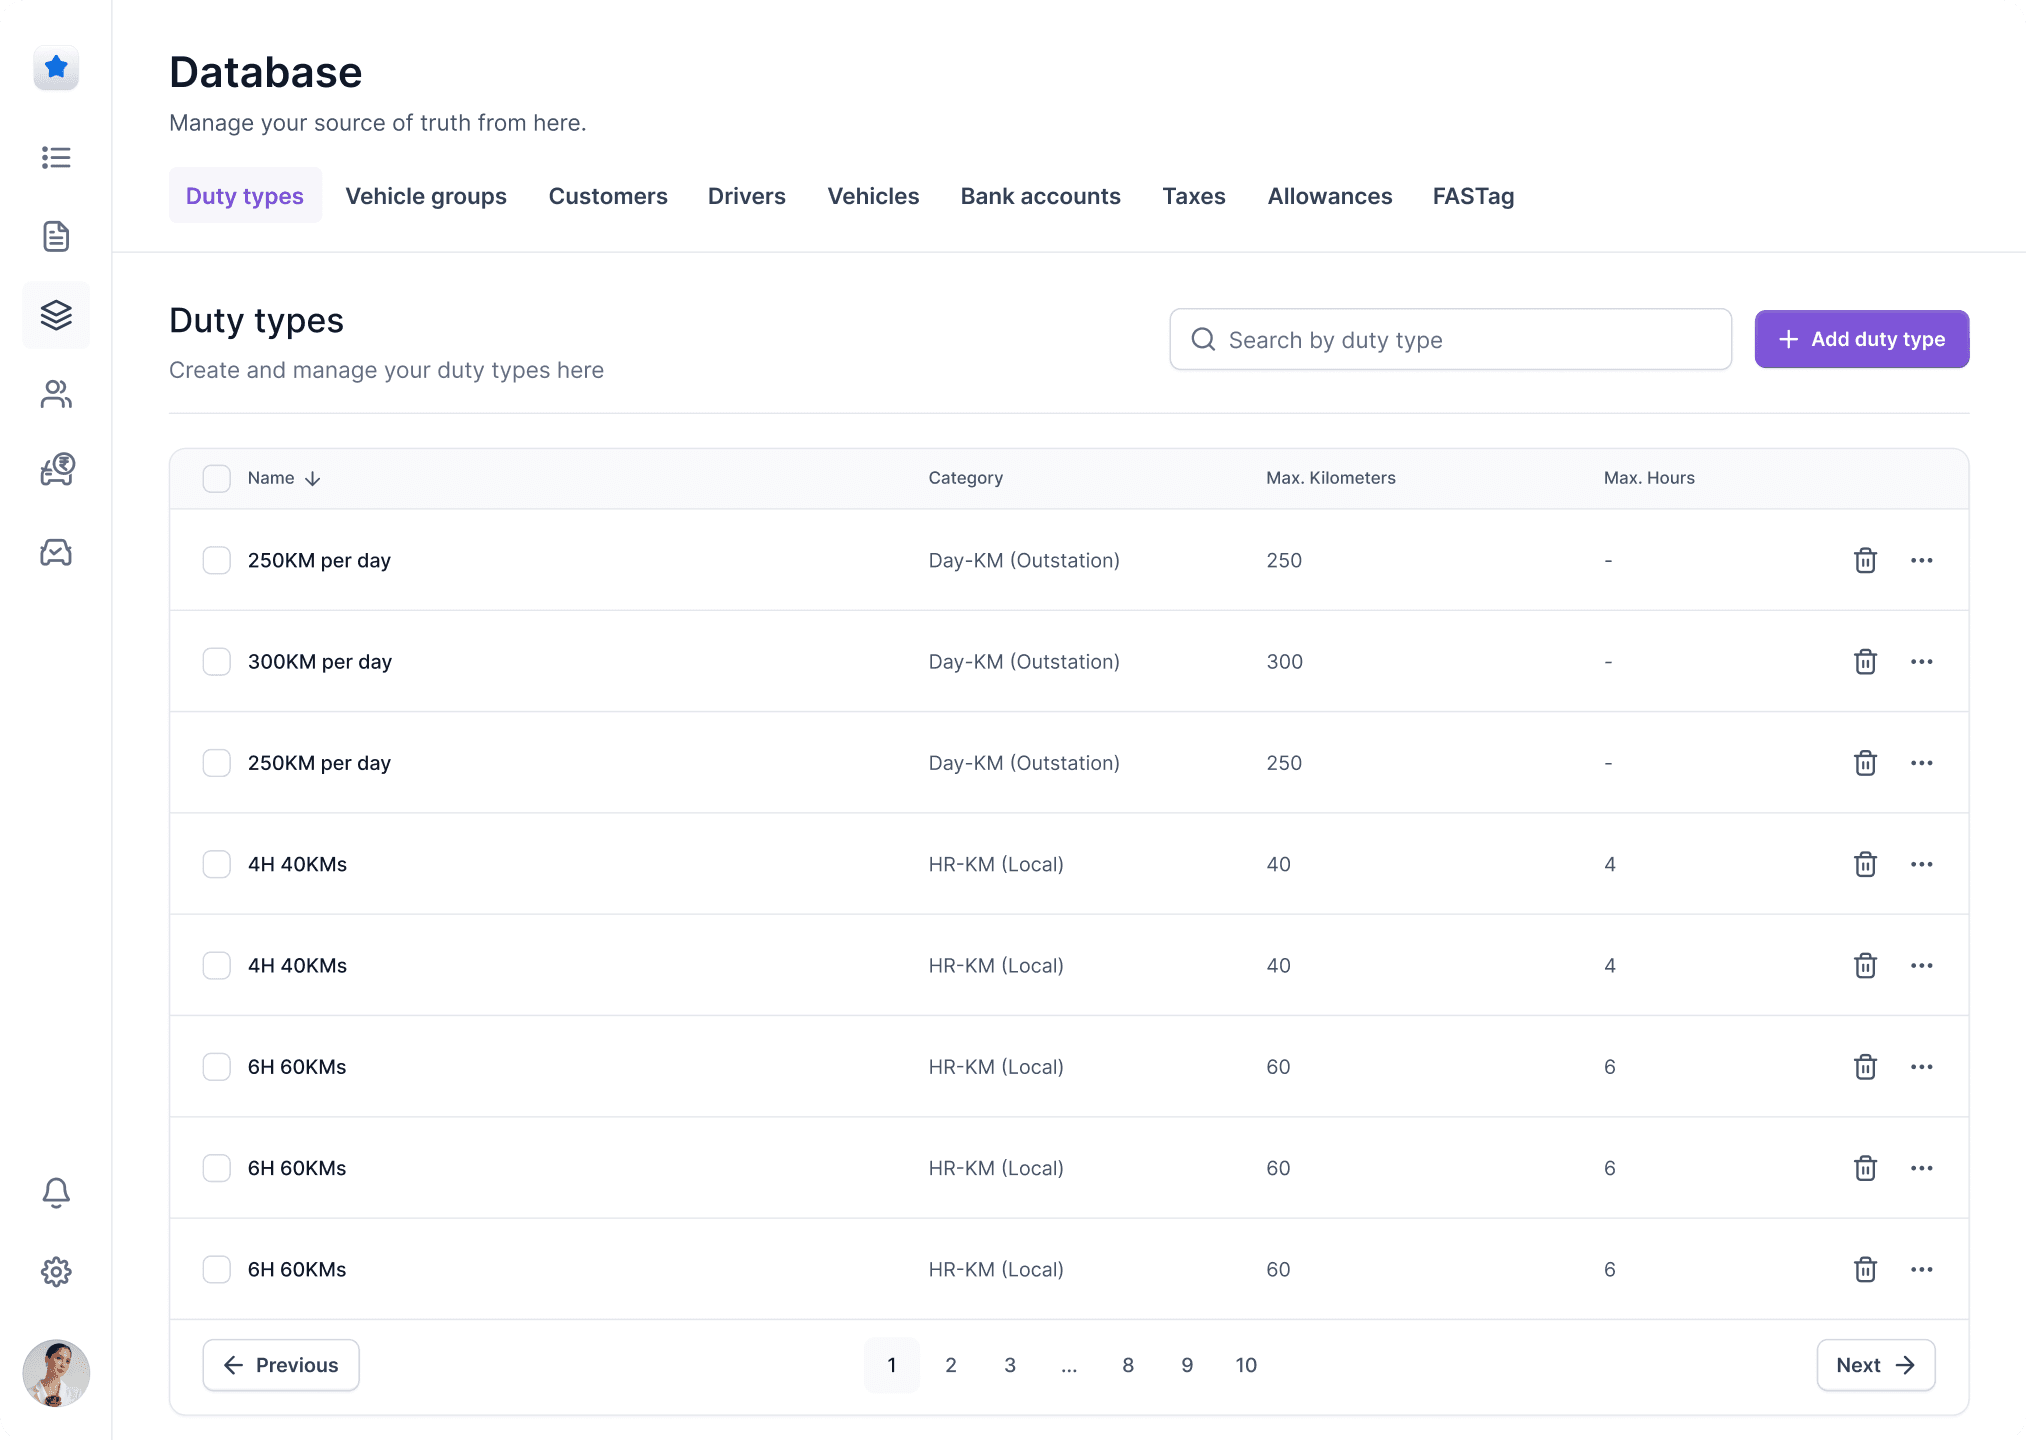
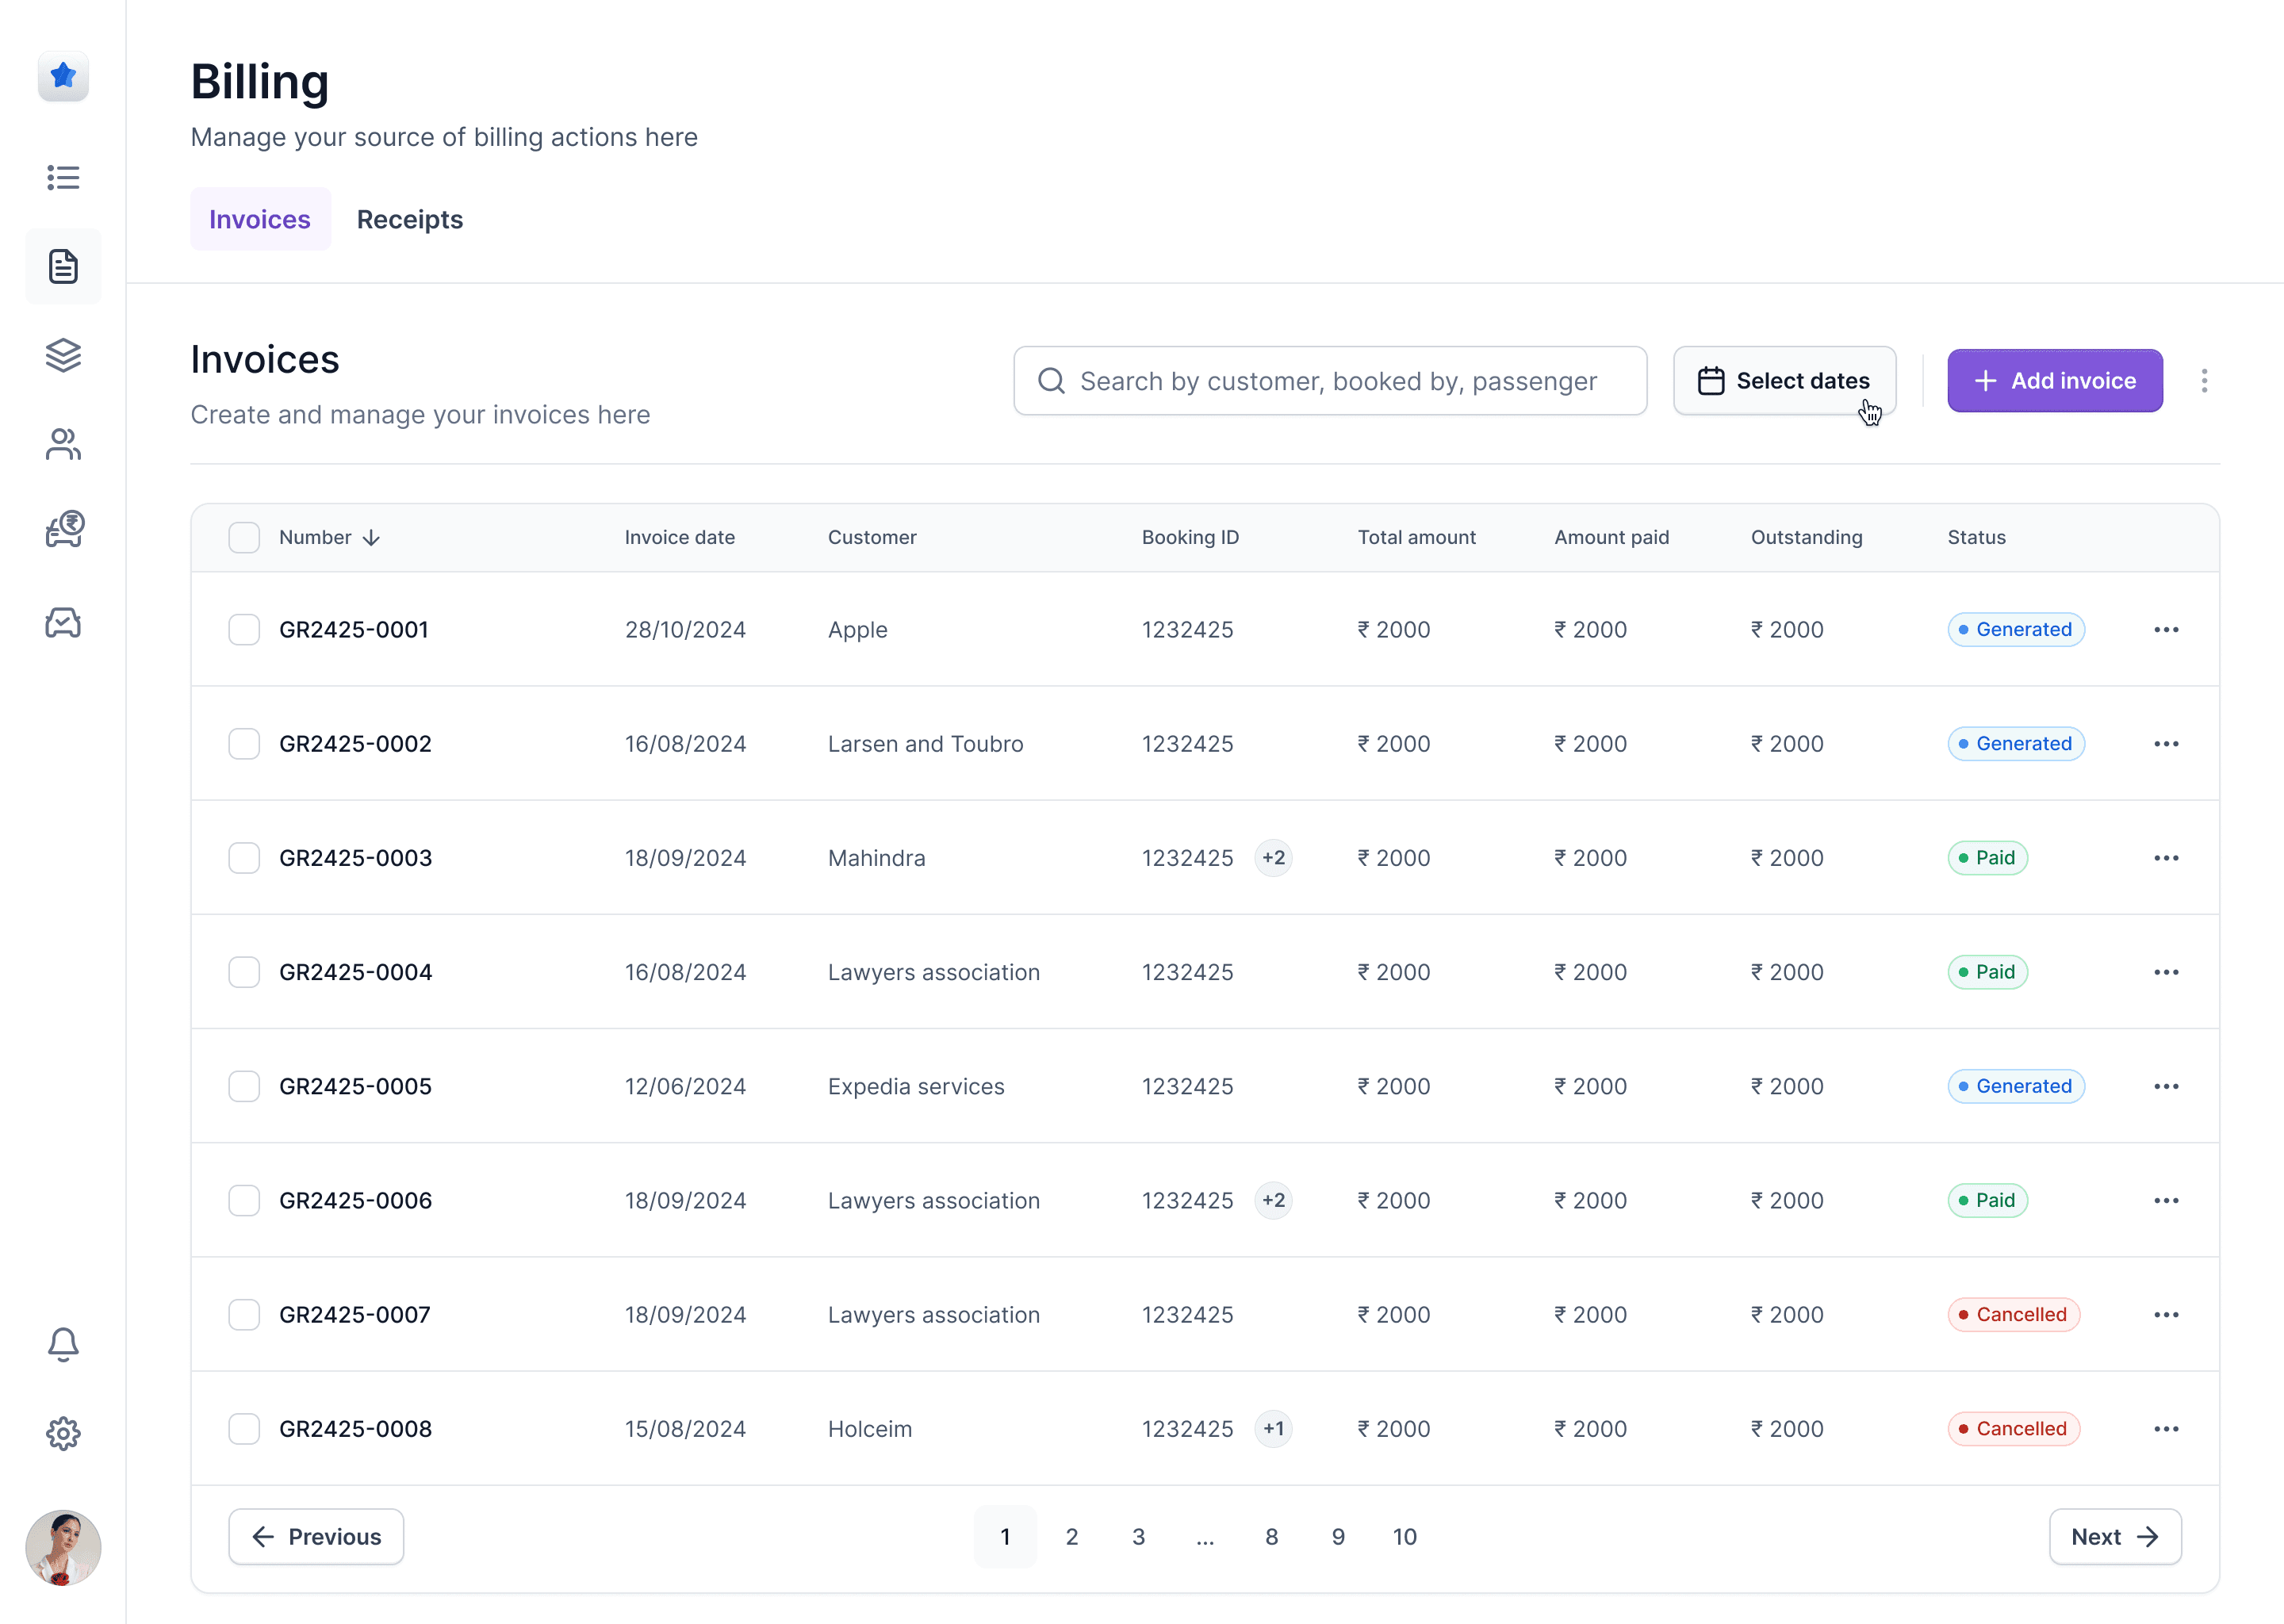
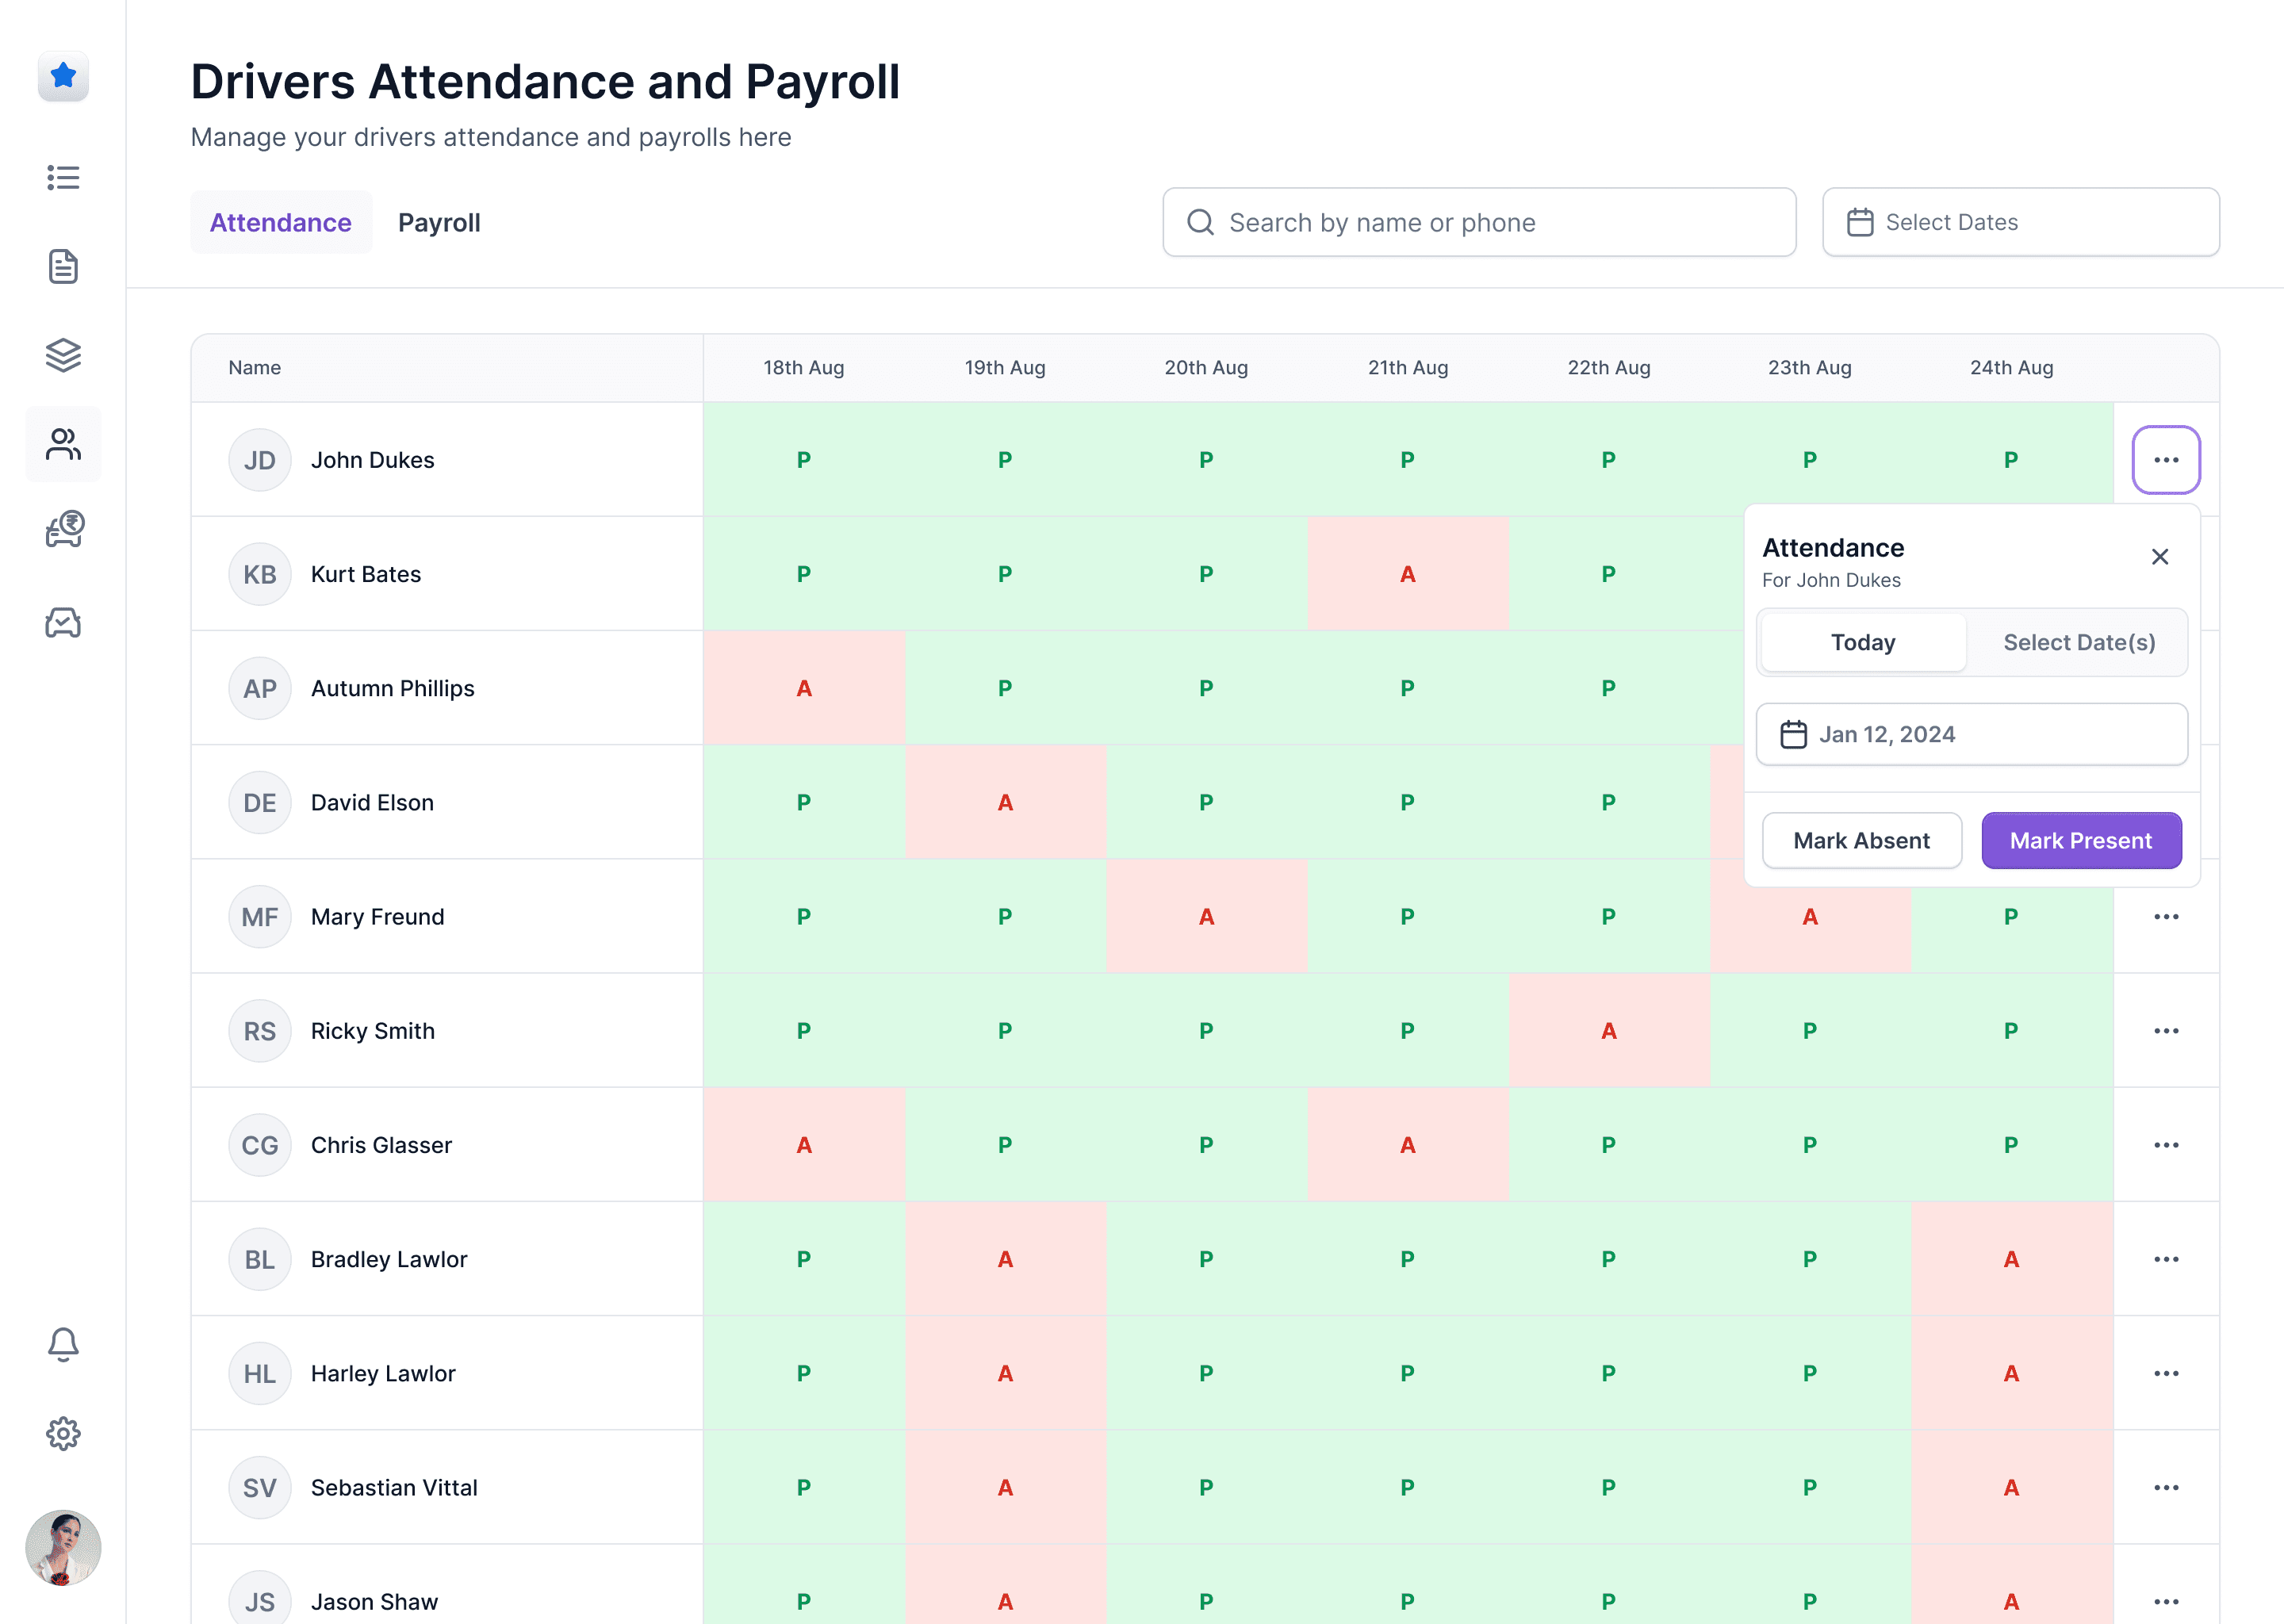
Five modules. One central database. Every module reads from and writes to the same source of truth, with no syncing, no reconciliation, and no data living in two places.
Admin & Management
CORE
Fleet-wide oversight, utilisation analytics, cost reporting, and team access controls.
Fleet & Vehicles
CORE
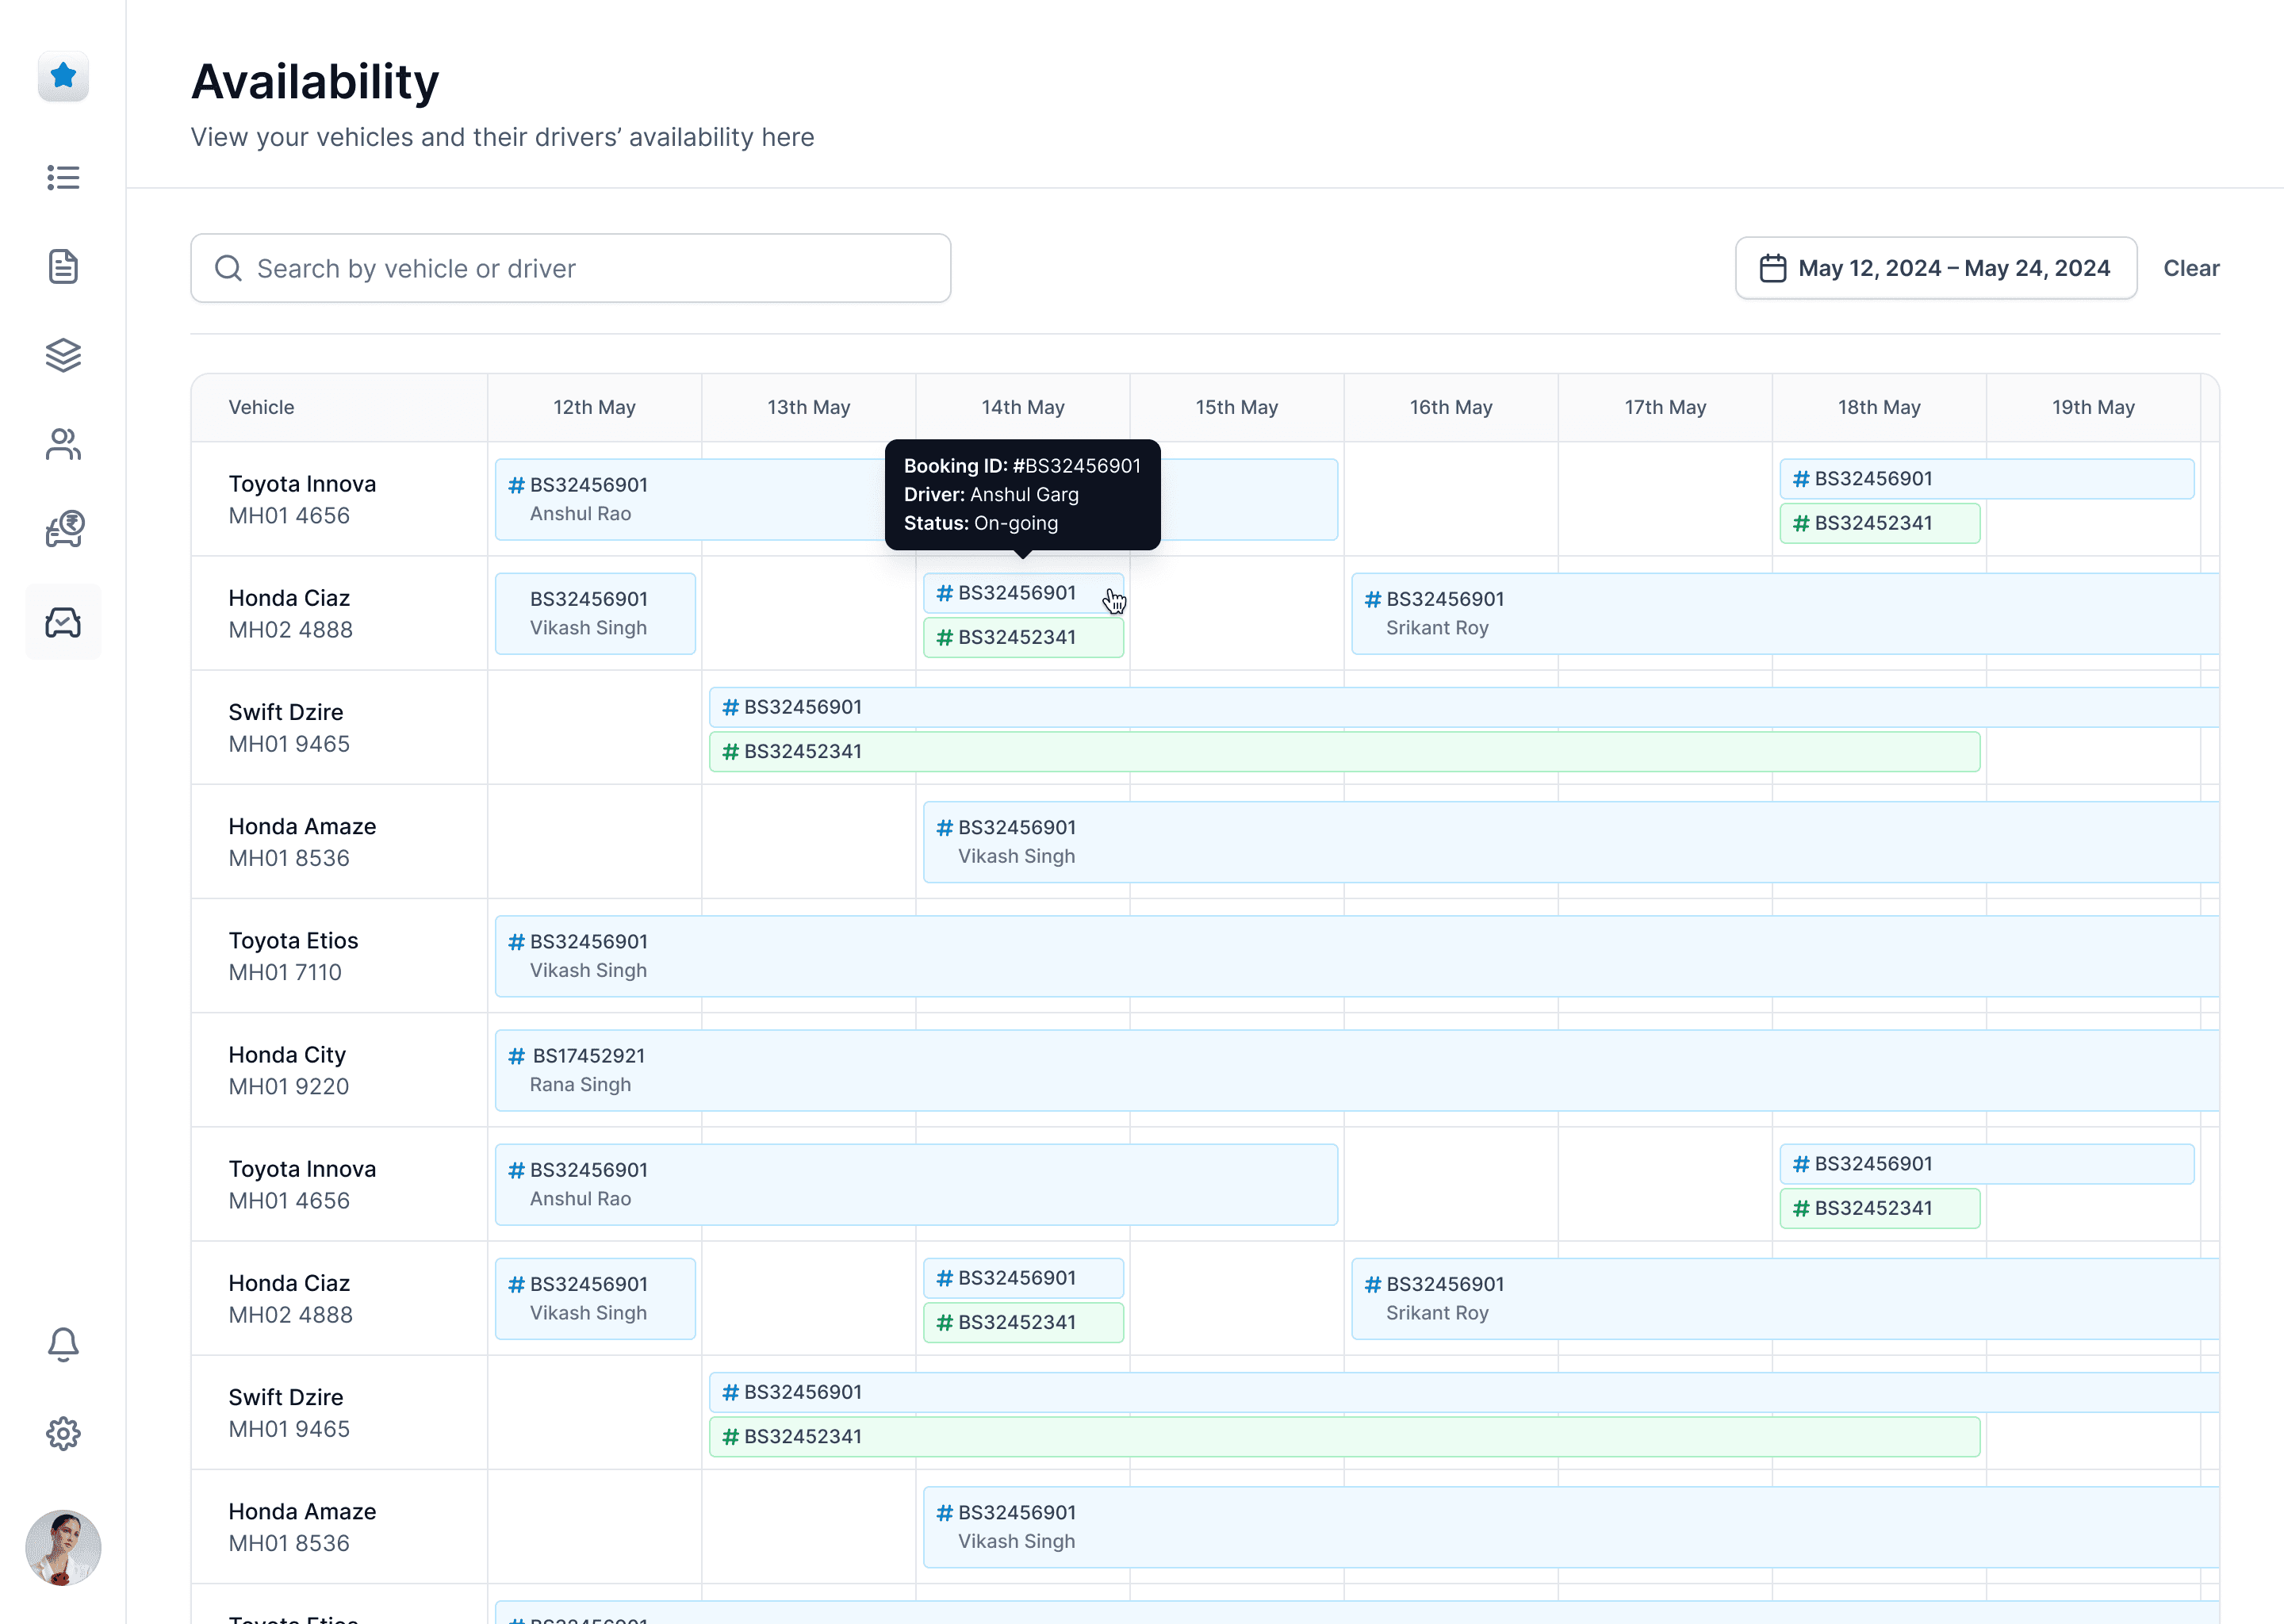
Availability calendar, maintenance scheduling, document expiry tracking, and real-time status.
Accounts & Finance
CORE
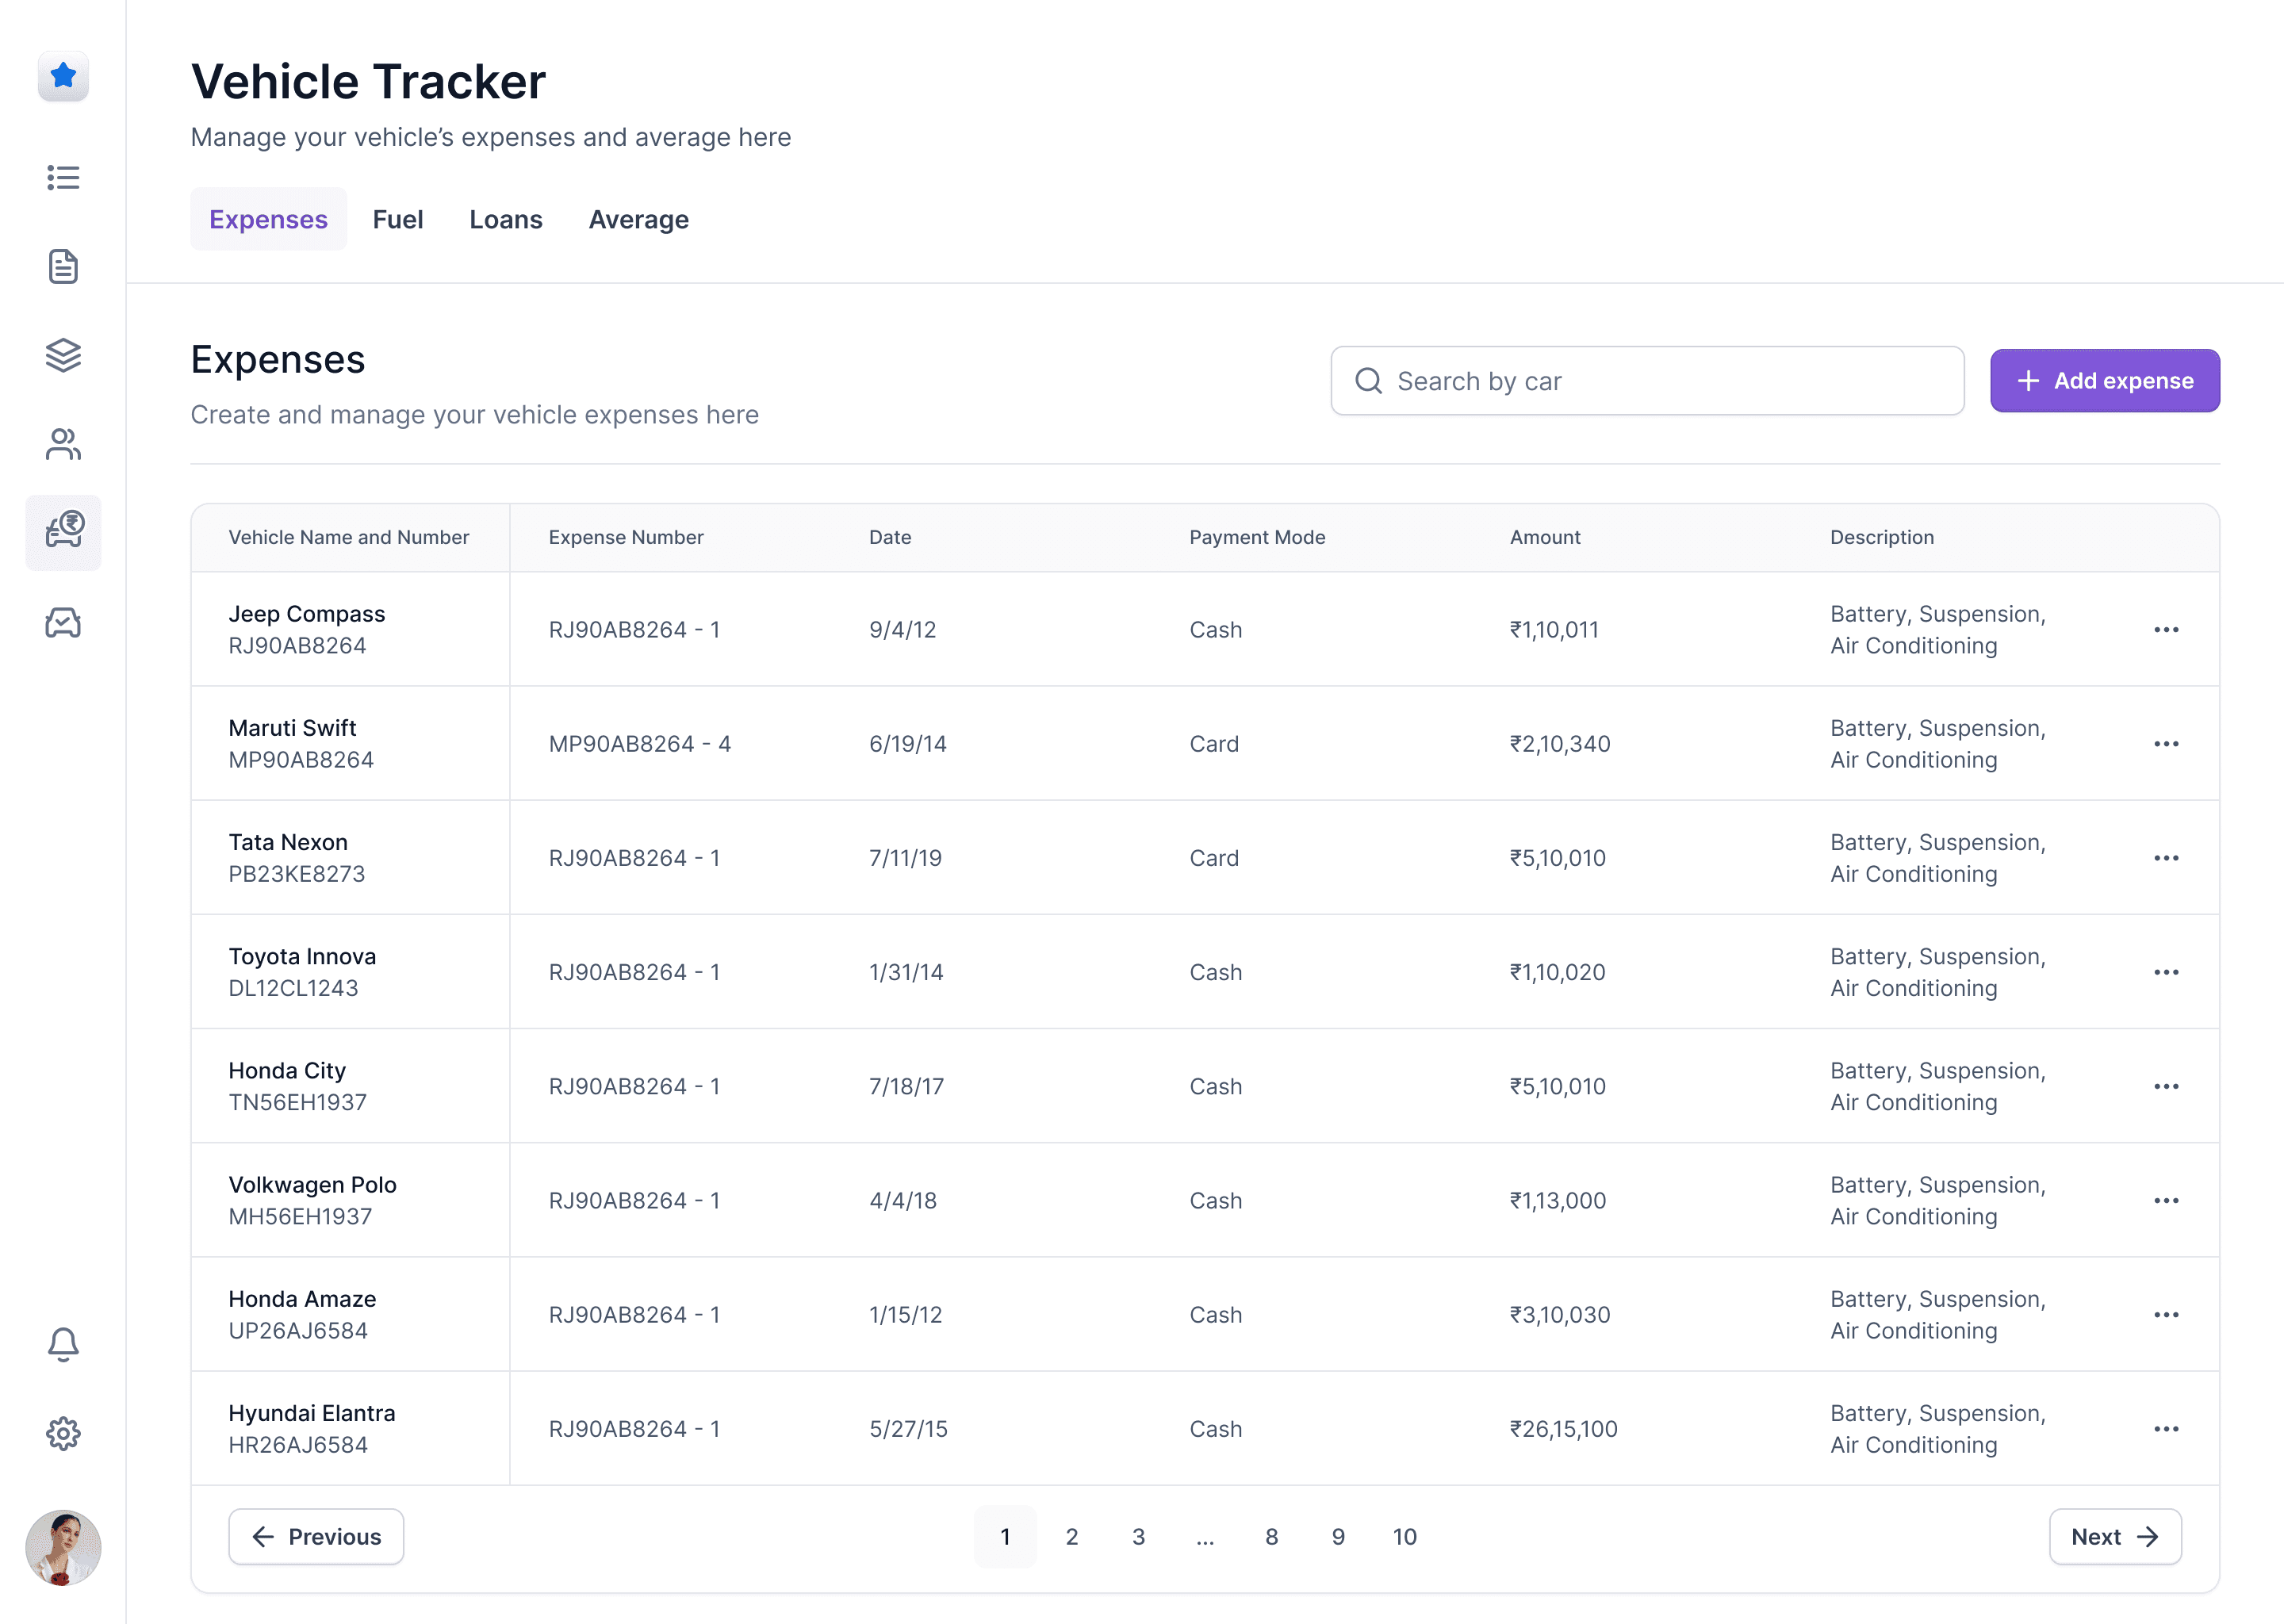
Expense logging, invoice generation, vendor payables, and payroll, all connected to trip data.
Booking
CORE
Responsible for creating booking, assigning and dispatching vehicle and generating duty invoice
Drivers
CORE
Allocation, duty history, document management, and performance tracking in one profile.
Integrations
Peripheral
Third-party APIs for routing, payment gateways, and compliance checks.
PRODUCT OVERVIEW

04
Post-delivery findings
After launch, we ran structured interviews with fleet operators using the new system. Manual operations dropped significantly. The platform had solved the coordination problem but hadn't moved the numbers the business cared about.
IMPROVED
~75%
REDUCTION IN MANUAL OPERATIONS
Almost no conciliation efforts with the streamlined workflow and single source of truth.
IMPROVED
6%
DECREASE IN BOOKING CONFLICT
Only available vehicles and driver shows up during bookings, avoiding any conflict.
DID NOT IMPROVE
Almost zero
IMPROVEMENT IN FLEET UTILIZATION
Fleet utilisation was directly tied to revenue, and the matrix remained flat.
The platform exposed deeper operational gaps that hadn't been addressed yet.
05
Problem with the new workflow
The simplified booking flow created a clean, linear process on paper. But step 3, "Duty in progress," was still a black box.
NEW BOOKING FLOW
Booking created
A job request is logged in the platform replacing manual calls and spreadsheet entries.
Driver & vehicle assigned
The duty gets assigned to an available driver automatically- driver gets notified
Duty in progress
Booking level and duty level status for the operator
No real-time, reliable visibility
Billing triggered
On duty completion, an invoice is
generated automatically
ROOT CAUSE - DRIVER LED DUTY COMPLETION
CURRENT DUTY
TIME →
NEXT DUTY
delay for expected reasons (such as traffic)
time it takes to reach next duty
driver informed completion here
BUFFER
driver led duty completion
The system depended entirely on driver input to mark completion and only then the system updated the status to the operator.
Passenger picked
→
Completed
NO VISIBILITY IN BETWEEN
WHY WAS VISIBILITY IMPORTANT?
TO STOP DELAYING CASCADING TO NEXT DUTY
The problem wasn’t just visibility. It was the need to intervene early for probable delays by assigning that duty to another available driver
NEXT DUTY
CURRENT DUTY
CURRENT DUTY
6:00 PM
6:08 PM
BUFFER
45 MINS
7:00 PM
7:30 PM
6:30 PM
7:45 PM
7:45 PM
DRIVER A
DRIVER B
COULD COVER DRIVER A’s DUTY
delay for expected reasons (such as traffic)
Driver B is available and could cover for Driver A's next duty if informed early
06
Solving for trust and reliability
To solve for the challenge of optimising visibility in potential delays, I had to find solution for 2 important technical questions.
Two questions to solve
QUESTION 1
How to determine current location of a vehicle in a low-trust, noisy, real-world system?
CONFIDENCE SCORE
With the help of engineers I worked on a real-time score that predicted whether an in-progress duty is running on time.
completion confidence score = (Driver × 0.35) + (Geo × 0.55) + (Time × 0.10)
QUESTION 2
How do we detect the risk of a delay before it becomes a delay?
CASCADING DELAY FRAMEWORK
This framework triggers an alert to the operator about any cascading delay by calculating the downstream risk for the next duty.
Estimated completion of Trip A + Travel time to next pickup > Pickup window start of Trip B — with less than X minutes of buffer remaining.
X = the design lever we set at 10–15 min
07
Designs Explorations
Once the system level complexities were taken care, the core UX question became
How do I notify operators without overwhelming them? How intrusive should alerts be? How much context should they carry?
OPTIONS CONSIDERED
OPTION 1
At- risk duty section
A dedicated panel within the scheduling view surfacing all duties flagged as at-risk, separated from the main duty list.
PRO
High signal-to-noise; surfaces only what needs attention.
CONS
Doesn’t scale well as the number of risks increases.


OPTION 2
Risk of delay
snackbar
A non-intrusive toast notification that fires when the confidence score drops below a threshold. Dismissible, low-footprint.
PRO
Immediate and hard to miss; drives quick action.
CONS
Doesn’t scale well as the number of risks increases.
OPTION 3
Inline at - risk
info
A contextual flag on the duty table itself, with a colour-coded row below it's duty.
PRO
Zero context-switching. Risk is visible exactly where the duty lives.
CONS
Multiple expanded rows simultaneously gets visually heavy.


OPTION 4
Dedicated 'At Risk' table
A centralised view with dedicated table for deeper assessment and action.
PRO
Best for high-volume operations. Actionable from a single surface.
CONS
Requires proactive effort from operators to navigate.
CHOSEN
Combined approaches
This balanced:
visibility
urgency
actionability
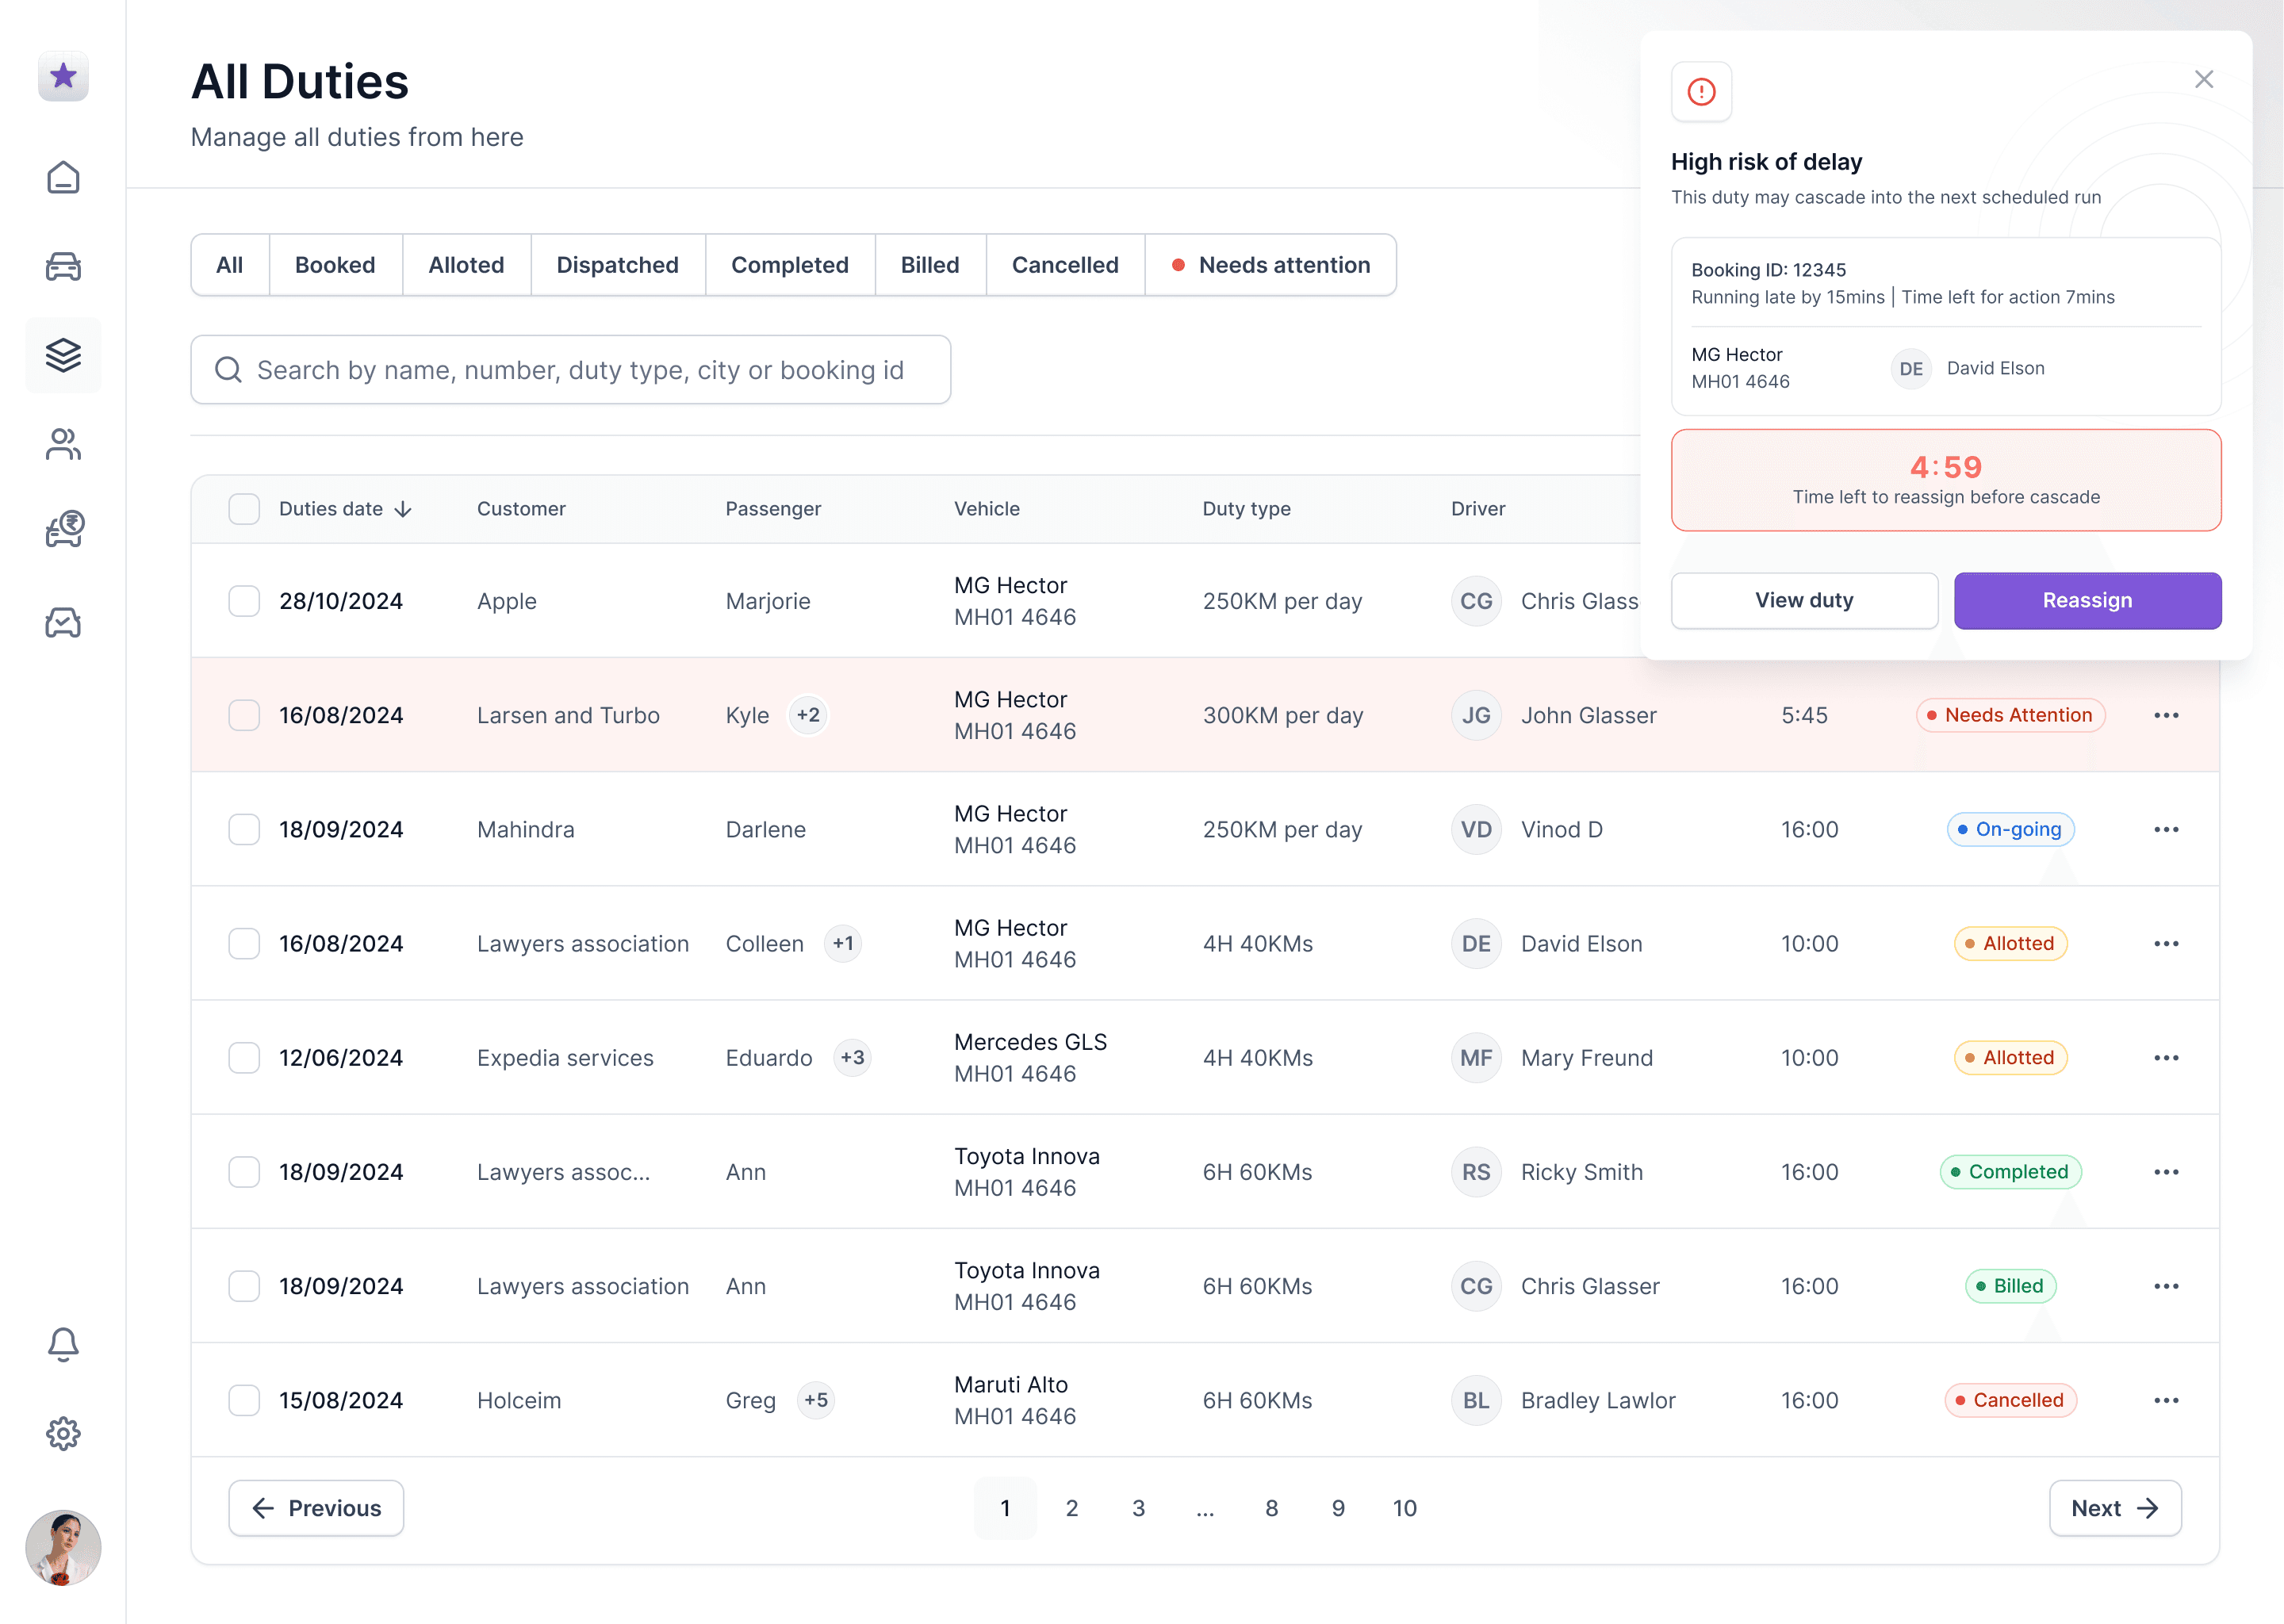
Snackbar
Handles the interrupt and fires once, creates urgency, and surfaces the minimum information needed to act
COLOR
The change in colour on the main table ensures the risk stays visible even after the snackbar is dismissed.
DEDICATED TABLE
The dedicated table is where the operator lands to asses and take actions.
08
Overall Impact
With that along with reduction in manual operations. The platform also helped improve the business metrics by reduction in cascading delay incidents
IMPROVED
~75%
REDUCTION IN MANUAL EFFORTS
Almost no conciliation efforts with the streamlined workflow and single source of truth.
IMPROVED
6%
DECREASE IN BOOKING CONFLICT
Only available vehicles and driver shows up during bookings, avoiding any conflict.
IMPROVED
~8%
IMROVEMENT IN FLEET UTILIZATION
Fleet utilisation became better directly leading to an increase in revenue.
09
Reflections
Solving for the biggest problem does not necessarily mean a change in the business metrics. The business metric story was more complicated, and that complexity is worth documenting, not hiding.
The framentation problem was real, impactful, and worth solving. Operators experienced genuine relief. But fleet utilisation barely changed, not because the solution was weak, but because it surfaced the actual problem.
Trust and reliability as a design problem
Trust as the real design problem; the system earned adoption by being consistently right, not by being prominent
The end
hello
hola
salut
prego
namaste
ni hao
olá
ciao
s̄wạs̄dī
hallo

Yashvardhan Bhardwaj
Senior User Experience Designer
Designed with ❤️, Logic, and AI.
Copyright ©2026. All rights reserved.
Designed with ❤️, Logic, and AI.
Copyright ©2026. All rights reserved.
Yashvardhan Bhardwaj
Senior User Experience Designer
hello
hola
salut
prego
namaste
ni hao
olá
ciao
s̄wạs̄dī
hallo

These case studies goes deep and are built for bigger screens.
For the complete walkthrough, detailed interactions, and full visuals, view them on desktop.